Graph Writing # 75 - Global sales of games software, CDs and DVD or video
- Details
- Last Updated: Sunday, 26 July 2020 19:10
- Written by IELTS Mentor
- Hits: 64574
IELTS Academic Writing Task 1/ Graph Writing - Column Graph:
» You should spend about 20 minutes on this task.
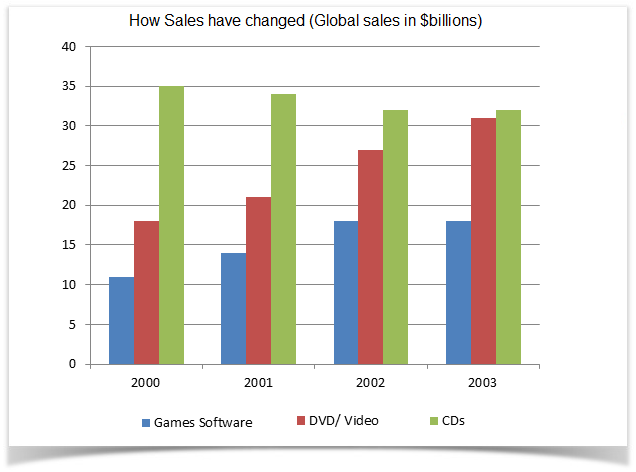
The chart below gives information about global sales of games software, CDs and DVD or video.
Write a report for a university lecturer describing the information.
» You should write at least 150 words.
Sample Answer:
The given bar graph shows the sales amount of Games, CDs and DVDs in the world from the year 2000 to 2003. As is observed from the graph, the sales volume of games software increased over the year and CDs were the most sold items in terms of its sales amount among the given items though VDVs slowly replaced CDs.
According to the data, in the year 2000, the sales amount of CDs was 35 billion dollars worldwide. In this year the sales amount for DVDs/ Video and games were less than 20 billion dollars. The sales amount of these three items remained almost same in the next year with some increment in the sales amount of VDV and games. Over the year the sales amount of CDs decreased and finally reached to just over 30 billion dollars in 2003. On the contrary, the sales amount for DVD/ Video increased significantly and the amount reached almost near the sales amount of the CDs. Similarly, the sales amount of games increased and reached to over 15 billion dollars in 2003.
In summary, DVDs gradually replaced the CDs and games software sales increased for the given period of time.


In details, the global CD sale amount was 35 billion dollars in 2000. But in the next three consecutive years, its sale amount decreased gradually and in 2003 it made $3 billion less. On the other hand, the sale amount of DVD/Video increased significantly from 18 billion to 32 billion dollars between 2000 and 2003. Finally, the sales of Games and software augmented steadily from 11 billion dollars in 2000 to $18 billion in 2003. So, during the given period, CDs popularity was slowly replaced by the popularity of DVDs and games also gained their popularity which is clear from the increasing sales each year.
Answer: The bar chart illustrates worldwide changes in sales of three different storage and software items - games software, DVD/video and CD in billion dollars from 2000 to 2003.
Overall, games software and DVD/video sales went up rapidly during the given time. However, CD experienced a slight decline in its sale amount.
In details, games software were less popular in the year 2000 among the three items. It was sold around 12 billion dollars globally. But in 2003, sales of games software went up to approximately 20 billion dollars, $8 billion higher than the previous period.
Similarly, DVD/video experienced noticeable growth in sales. In 2000, it was sold for around 18 billion dollars. In 2003, DVD/video sale amount was 32 billion dollars, which was slightly lower than the sales amount of CDs this year. In comparison, CD sale amount was the highest in 2000, but it became less popular over time, but still, in 2003, the CD made the highest sales with nearly 33 billion dollars. It is evident that DVDs started to become more popular over time while the demand and sale of CDs started to decline.
Generally speaking, DVD/video sales amount increased steadily during that time despite the highest sales amount of CDs.
As is presented as a census of a perusal, 11 billion dollars sale was recorded for the games software in 2000 and after approximately 30% growth this volume reached to 14 and 17 million in 2001 and 2002 respectively. Its sale amount remained the same in 2003 as it was in the previous year.
In a similar scenario, DVD/video sales swelled up monotonously and after a big jump in 2002, it met 31 billion dollars in 2003 as its peak. In contrary, the CD sales declined slowly and received to 32 billion dollar sales as nadir in later year from 35 billion in 2000.
It is noticeable that the popularity of game software and DVD/video increased during that time and people were paying more money in each year than the last year to purchase those media items.
Report