Graph Writing # 77 - Enrolment in different colleges in the Higher Colleges of Technology
- Details
- Last Updated: Sunday, 26 July 2020 19:11
- Written by IELTS Mentor
- Hits: 72763
IELTS Academic Writing Task 1/ Graph Writing - Column Graphs + Pie Chart:
» You should spend about 20 minutes on this task.
The graphs show enrolment in different colleges in the Higher Colleges of Technology in 1999.
Write a report for a university lecturer describing the information given.
» Write at least 150 words.
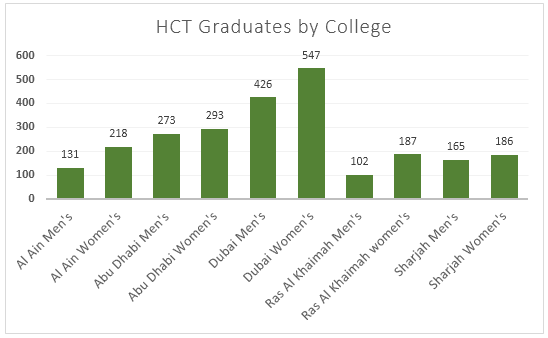
HTC Graduates by Colleges
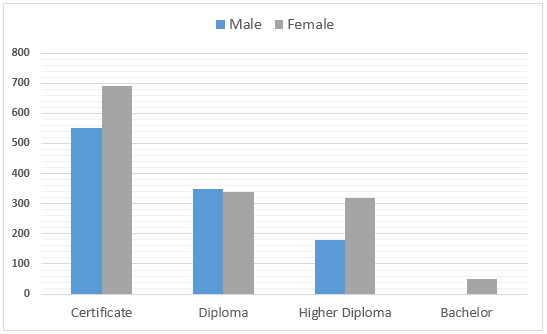
HTC Graduates by levels and genders
Sample Answer 1:
The given graphs show the students’ enrollment in the Higher College of Technology for the year 1999. As is presented in the graphs, Dubai University had the largest number of male and female enrolled in 1999 and majority of those students achieved their certificates than other degrees.
According to the graphs, more women got enrolled in the Higher College of Technology and the number ranges from 100 to almost 600. Among the enrolled students, the number of females was more than the male. No data for the male graduate was given and for higher diploma and certificate courses, women exceeded the number of males.
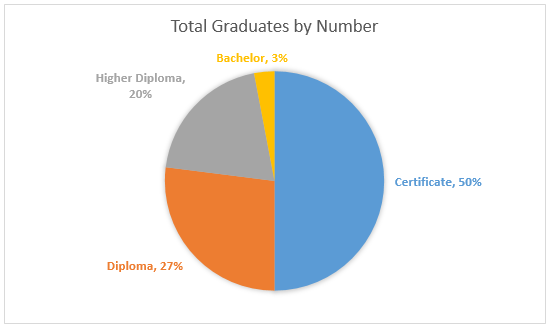
According to the pie chart, half of the enrolled for certification courses while 27% had been in Diploma courses. 20% of the total students got enrolled in higher diploma while only 3% got enrolled in bachelor degree.
In summary, the number of diploma and certificate students was significantly more than the number of bachelor degree students in Higher College of Technology and female superseded the male in terms of their number on those courses.
Sample Answer 2:
The graphs presented give information about the number of students enrolled in 10 different Higher Colleges of Technology (HCT) branches across UAE by gender and the level of college education they achieved. Overall, Dubai Women’s College has the highest number of enrolment among all the colleges while Ras Al Khaimah Men’s College has the least number of students.
As is presented, there are more female graduates than male graduates and most of the students finished with Certificates. Bachelor’s degree has the least number of graduates and there are no male students under this level. In terms of the number of graduates in Colleges, Dubai Women’s has the largest number of successful students with a population of 547 followed by Dubai Men’s with 426. Abu Dhabi Women’s had 293 graduates, 20 students more compared to Abu Dhabi Men’s graduate with only 273. A majority of the graduates are female. Both male and female students graduated mostly with certificates. Just under 700 graduates were female and around 575 graduates were male in the same level. As is observed there are no male students in bachelor’s level and there are approximately 60 female students on this level making it the least number of lever achieved by the students. The pie chart shows that 50% of all the students graduated with certificates. 27% of which graduated with a diploma. Higher diploma level was 7% lesser than that of the latter while only 3% achieved the bachelor’s degree.
[ Written by - Jaycee ]


Overall, the number of enrolled women in all colleges was higher than the number of men, and the same for the graduation level.
In details, Dubai women's college took up the highest number of graduate students which was 547, and for men, the reverse trend was true where the lowest number of graduates were from Al Ain men's college - 131 students. In terms of graduation level, the highest percentage of students completed certification level education, which represents half of the total graduates and female students were higher than males. Diploma and higher diploma represents 47% of students, where the number of female graduates from these divisions was nearly the same, approximately 340.
Interestingly, the males who took higher diploma were significantly higher than those who took diploma courses, about 350 and 190 respectively. Finally, females only completed bachelor level and it was a very small percentage, only 3%.
Report