Graph Writing # 81 - The two graphs show the main sources of energy in the USA
- Details
- Last Updated: Monday, 17 August 2020 17:39
- Written by IELTS Mentor
- Hits: 158670
IELTS Academic Writing Task 1/ Graph Writing - Pie Charts:
» You should spend about 20 minutes on this task.
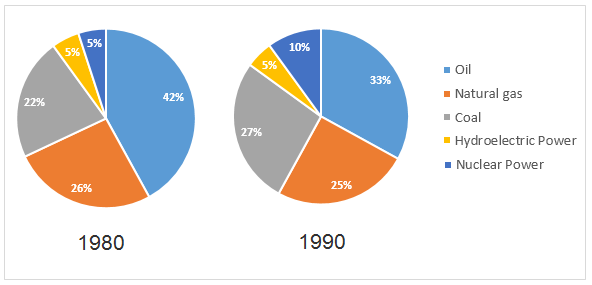
The two graphs show the main sources of energy in the USA in the 1980s and the 1990s.
Write a report for a university lecturer describing the changes which occurred.
» Write at least 150 words.
Sources of Energy, USA, in the 1980s and 1990s.
Model Answer 1:
The pie chart depicts the use of different sources of energy in the USA in two decades – 1980s and 1990s. An overview of the diagram shows that the major source of energy in the USA was oil in both decades, and the use of nuclear power as a source of energy doubled in just ten years.
The graphs show that oil was the main energy source for the USA which was used to produce 42% energy in the 1980s and 33% in 1990s. It shows that oil produced energy declined in 1990. Around one-fourth of energy in the USA came from natural gas both in these decades. The use of nuclear power as a source of energy increases and it produced 10% energy in the 1990s which was double than the percentage of energy production from this source in the previous decade. The production of energy from coal in the 1980s was around 22% and it increases by 5% in 1990s. It is very surprising to notice that the production of energy from hydroelectric power remained the same (i.e. 5%) in both decades.
[Written by – Reshma]
Sample Answer 2:
The given pie charts show data on the main energy sources in the United States of America in two decades. As is presented in the pie charts, oil was the main energy source for the USA both in the 80s and 90s but the use of oil and coal had reduced and their places as energy sources were somewhat replaced by the use of nuclear power in the USA.
According to the given data, oil was the main energy source in the USA which was 42% in 1980. The second-largest energy source in this decade was the natural gas which supplied 26% of total energy in the same period. Then coal supplied more than 20 per cent energy demand in the USA while hydroelectric power and Nuclear power both supplied 5% of the total energy.
In the next decade, Nuclear power produced one-tenth of total energy demand and that was almost double that it was in the previous decade. The hydroelectric power as an energy source remained unchanged as it provided 5% of total energy demand in this decade also. The two other main sources of energy in the USA remained almost unchanged in this decade and those two sources were Coal and Natural Gas. Finally, the use of oil as an energy source reduced to 33%, which is almost 10% less than the previous decade but remained the largest source albeit the reduction in this 90s decade.


Overall, oil was the main source of energy production in the USA, and nuclear power was the fastest-growing energy in this country during the given period.
According to the diagrams, oil had been the most important source of energy throughout the period, although the proportion of this energy declined from 42% to 33%. Around one-quarter of energy in the USA came from natural gas in both decades, with merely a slight drop of 1%. The usage of hydroelectric power remained the same (5%) over the two decades.
On the other hand, coal as a source produced 22% of the energy in the 1980s and this figure increased by 5% in the following ten years. At the same time, nuclear power experienced a quick development, supplying 10% of the energy in the 1990s, twice the percentage from this source in the early decade.
Generally speaking, the largest energy source was oil in both years but the nuclear power source of energy played a vital role and its use doubled in a decade.
In the USA, the largest energy source was oil in 1980 but in 1990 the was a significant fell in its usage and dropped to 32% from 42% but, still remained at the top. The second highest source was natural gas in both the years and in 1990 there was a small change in the usage percentage. Hydroelectric power was at the bottom in both calendar years and at the same level but the energy source that had the most acceptance was Nuclear power whose use almost doubled from 1980. The energy source that accounted for 22% in 1980 and 27% in 1990 was coal and a little increment was noticed after a decade.
Overall, oil was the main source of power in the USA both in the decades but the use of oil as an energy source decreased while the use of nuclear power doubled.
To begin with, despite being the main power source in the USA, oil's use declined in the 1990s to 33% from 42% in the previous decade. Hydroelectric power as an energy source in the USA had not changed through the two decades and contributed towards 5% of overall power productions. Moreover, natural gas produced one-quarter of the total energy demand in the USA in both decades. Coal was another important energy source and it produced 27% power for the USA in the 1990s and that was 5% more than it was in the early decade. Finally, nuclear power generated only 5% power in the 1980s but its contribution doubled in the 1990s.
As is obvious, in both decades oil was the main source of energy in the USA, and the use of nuclear power as energy sources doubled in 10 years.
In details, oil constituted a substantial percentage of energy in the 1980s and 1990s in the USA - 42% and 33% respectively. And it indicates that there was a decrease in the use of oil as an energy source in 1990 by 9%. Natural gas was the second common resource of power in 1980, but its use decreased slightly by 1% and reached to 25%. The rate of coal usage rose by 5% and occupied the second place of energy source in 1990 with 27% power generation for the USA. In terms of nuclear power, its use doubled in just ten years to become 10% from 5%, whereas the level of hydroelectric power remained constant at 5% in both decades - 1980 and 1990.
Report