Graph Writing # 85 - The charts show the result of a survey of adult education
- Details
- Last Updated: Thursday, 05 May 2022 00:33
- Written by IELTS Mentor
- Hits: 341452
IELTS Academic Writing Task 1/ Graph Writing - Bar Graph + Pie Chart:
» You should spend 20 minutes on this task.
The charts below show the results of a survey of adult education. The first chart shows the reasons why adults decide to study. The pie chart shows how people think the costs of adult education should be shared.
Write a report for a university lecturer, describing the information shown below.
» You should write at least 150 words.
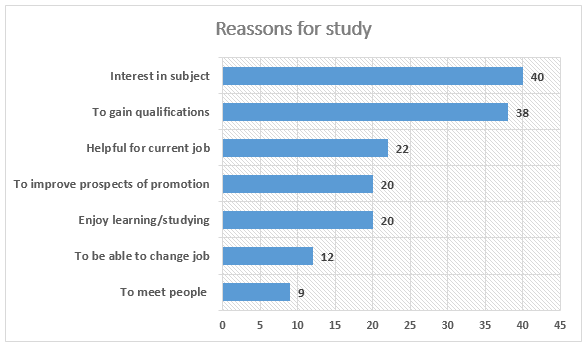
Reasons why adult people decide to study (figures in percentages)
Sample Answer 1:
The figures illustrate the result of an opinion survey about the reason why adult people choose to study and how tuition costs should be funded. It is clear that based on the survey result, the two main reasons why adults have continued their study are due to they are interested in subjects and to obtain the degree. It is also noticed that the survey also shows that most of the education cost should be funded by individuals themselves.
It can be seen that the two main purposes why adult continue their study are because they interested with the program and to obtain the qualification, as these two reasons result reached 40% and 38% respectively. Meanwhile, the percentages of the survey for reasons of helpful for their current job, improving prospect and promotion, and that they like studying were in the range between 22% and 20%. As for figures of those who study for the purpose of changing jobs and to meet new people, they were below 15% each.
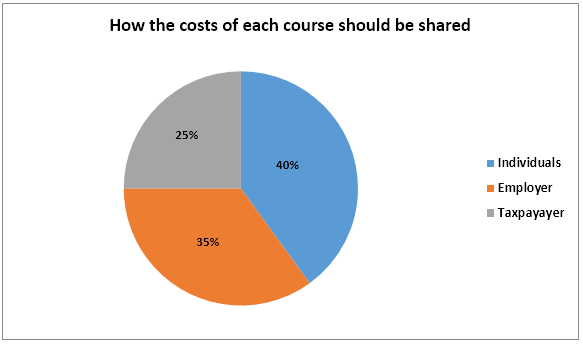
As for the survey result of the education cost, it is obvious that 40% of the cost should become the burden of the respective person themselves. Then 35% should be provided by the employer and 25% from the taxpayer.
[ Written by - Darwin Lasmana ]
Sample Answer 2:
The figures in the chart show what motivates adults to study and the ratio of funding for the same. Overall, it is apparent that most students are lured to study due to their love for the subjects and due to this, the largest portion of study cost must be borne by the individual himself, in their opinion.
The first chart intends to show that most students are keen to study due to their interest in a subject and to gain higher qualifications. The latter accounts for 38%; there being only 2% difference with the former at 40%. Out of 100, 22 students opine that studying would support their incumbent job. For those students who profess that study would help them in getting a promotion and that it is an interesting activity, an equal result is gathered (20%). A meagre number of students, 12% and 9%, feel that study would assist them to get a new job and that it will build acquaintances with new people.
From the second chart, it is seen that the individual should be the highest cost bearer for his own study (40%). Next, comes the employer at 35% and after that the taxpayer with the least burden (25%) of the cost.
[Written by - Paudyal]
Sample Answer 3:
The diagrams illustrate the motive of adult education and how the course fees should be funded, according to the survey participants. Overall, it can be observed that the primary stirring factors for adults to study is their interest in subjects and to enhance their qualifications. The largest proportion of the people opined that individuals seeking for further studies should bear the cost.
According to the data provided, we can clearly notice that 40% of the grown-ups continue their education due to their interest in subjects they study, while 38% enrol to gain qualifications. Whereas only one in five studies to improve their prospects of promotion, the same ratio enjoys learning. 22% continue their education because it is helpful for their running jobs. Finally, 12% study further to change their present jobs, and the remaining 9% study to interact with new people.
Regarding the cost of the courses, 40% of the survey takers think that adult education cost should be paid by individuals. 35% believe their employers should take the responsibility and only one-fourth outlines that it should be collected from the taxpayers' money.
[Authored by - Manaswees]
Sample Answer 4:
The graphs reveal the outputs of a research through education for adults. The first picture describes the motivation of adult who determines to study. The second picture unveils people’s opinion about how the cost of adult education should be done together.
The data supplied indicate that the major factor of adult education is due to attraction to subjects. However, meeting new people is considered as the least favoured purpose to study. Meanwhile, other varieties of assumptions on how adult education cost should be paid are presented in the second picture. Individual spending becomes the most chosen among the given options.
As being seen, the majority of adult prefer to get a study because of interest in subjects. Indeed, it gives 40 percent and indicates as the most favourable option compared to others. Nevertheless, adding new friends is definitely the lowest criteria with just under 10 percent.
Furthermore, the next graph provides clear information about the way of education costs in every course has to be dealt. It shows that the individuals should share the maximum cost as the highest percentage, with exactly 40 percent, should be managed by them. In contrast, taxpayers should bear 25% of this cost and the remaining cost, 35% should be supported by the employers.
Sample Answer 5:
The figures illustrate the outcome of a survey about the different intention why adults opt to further their education and their opinion on how the fees of each course should be funded.
It is immediately apparent that the interest in subject and gaining qualifications are the top reasons for adults’ decision to continue their education while each individual should fund the majority of their course fees.
By looking into details, interest in Subject has the highest result in the survey with 40 percent of the total outcome. It is closely followed by the reason to gain qualifications with only 2 percent difference at 38%. The following reasons which are helpful for the current job, to improve prospects of promotion and enjoy studying are about one-fifth of the total result ranging from 20% to22% while to able to change jobs and to meet people are just 17 percent combined.
Meanwhile, individuals top the result of cost sharing with 40 percent. Employers are just above thirds of the total result on how fees should be shared whilst taxpayer should share a quarter of the costs.
[ Written by - J. Mark ]
Sample Answer 6:
The given bar graph represents the different causes that provoke the adults to continue their education whereas the pie chart illustrates the opinion of people on how the proportion of course fee is to be distributed.
A majority of people are deeply indulged in their favourite subjects and dream to master in them. 38% of them want to gain qualifications to compete in the society. Out of 100, 22 people find it helpful for their current jobs. An equal number of students enjoy studying and the same 20 while another 20% anxiously wait for their promotions. Individuals who would like to change their jobs are just 12% of them and 9% are those who would like to enhance their friend's circle continue education.
According to the survey, the pie chart’s largest sector, 40%, represents the people who think that individuals should pay for their study. 35% people state that the employers and the remaining 25% think that taxpayers should pay the cost of the adult study.
[ Written by - Anzal Tehreem ]
Sample Answer 7:
The bar chart depicts why adults chose to study and the pie chart shows the people's opinion about the cost distribution of this adult study.
Overall it is evident that the most motivating factor for study among adults is due to their keen interest in the subject and the greatest proportion of the cost of study must be borne by the individual and the least must be borne by the taxpayer, according to people's opinion.
Having an interest in the subject is a crucial factor that inspires adults to further pursue their academic studies. This is shown by the fact that 40 percent of them opt for this single reason. Similarly, even the zeal to gain higher qualifications persuades 38 percent of adults to choose to advance their level of study. On the other hand, reasons like a support for their incumbent job, building certainty in promotions and study as a leisure activity quite indulges adults to study. These are evident at 22 percent, 20 percent and 20 percent respectively chose to study for these reasons. A small group of 12 percent focus on studying to be able to switch their jobs. However, the least motivating factor to study is to make new acquaintances, only 9 percent.
In addition to above, people opine that 40 percent of the adult education cost should be paid by themselves. On the other hand, employers and taxpayers have a comparatively lower share, in their opinion, at 35 percent and 25 percent respectively.
[ Written by - Bishal Raj ]
Sample Answer 8:
The provided bar graph and pie-chart demonstrate the result of a survey related to adult education. The former chart indicates the reasons why grown-ups decide to study while the latter displays how their academic costs should be dealt with.
Overall, a large number of grown-ups persuade further education due to their interests in subjects while others for a better career prospect. Individuals, employer and tax-payer should bear the cost of adult education, according to participants of the survey.
In details, 4 out of 10 adults continue their education due to their passion for subjects while 38% enrol in further education to enhance their job qualifications. Two such adults, out of ten, study to be promoted in their jobs while a similar ratio of people study since they enjoy learning. 12% continue further study to change their current jobs while the remaining 9% do it to gain skills to interact with others.
Furthermore, 40% people perceive that adult education cost should be paid by individuals followed by 35% employers' and a quarter opines that it should be collected from the tax-payers.
[ Author - Manisha ]
Sample Answer 9:
The given data shows why the grownup people continue their study and their opinion how the cost of this adult study should be shared.
According to the first bar graph, around 40% adults decide to study because of their interest in studying which is the most influential reason for adults to study. Gaining qualification is another important reason that influences more than 35% adult to continue their studies. Job-related reasons contribute to around 20% adult to decide to study while meeting people inspire around 10% people to study.
According to the pie chart, the people who have decided to do the further education think that 40% of this cost should be provided by the individuals who are getting enrolled in the study while 35% cost should be shared by the employer since they are deciding to study to do better in their job position. The remaining 25% cost should be shared by the taxpayers according to these people.
In summary, interest in subjects, improving qualification, better job position and improving communication with people are the reasons most adults decide to study and according to them the cost of this study should be shared by individuals, employers and taxpayers.


Overall, it is clear that the top two reasons why adults pursued higher education were to increase their qualifications and because of their interest in the course subject. Furthermore, most adults believed that individuals themselves should pay for their tuition costs.
As for the bar chart, people studying out of interest for the subject and to gain qualifications amounted to 40% and 38% of the survey respondents respectively. While only 1 in every 5 people studied to improve their future job prospects, this figure was the same for those that studied out of enjoyment and those who found studying to be helpful for their current career. 12% of respondents studied in hopes of changing jobs while the remaining 9% used education as a means to meet people.
As for the pie chart, a high number of survey takers, 40%, believed that individuals should fund their education by themselves. While slightly more than a third think employers are responsible for paying education costs. One-fourth also opined that taxpayers should cover the cost of tuition.
1. Opinion: This is a common belief of the researchers and cost should be shared by @ individuals, 5 employers, % tax-payers. We don't know what researchers say but the average distribution is like that.
2. Opinion:
@ of the researchers believe that individual should pay
5 of the researchers believe that employer should pay
% of the researchers believe that tax-payer should pay
Which one is correct?
Overall, it can be seen that majority of the adults study for their personal interests in the subjects, while a few of them study for meeting people. On the other hand, many people think that individuals should bear the study expenses, but only a few are of the opinion that taxpayers money could be used for that.
Looking firstly at the reasons, two-fifth of the survey participants, around 40, expressed their view that they study because they are interested in the subject they study. Acquiring qualifications is the second major reason for that, and 22 adults mentioned that study is helpful for their current job. Improving prospects of promotion and enjoying learning have exactly half as many adults as studying for interest in subjects. Although 12 adults stated that they study as it would enable them to change their jobs, 3 fewer adults pursue it for meeting people.
As the pie chart shows, 40% of people believe that individuals should be responsible for paying their own tuition fees; however, one-fourth of the people think it is the responsibility of the taxpayer. The number of people who think that their employers should bear the cost is almost 35%.
From the outcome of this opinion survey, participants’ motivations are plotted onto a bar chart to show a general consensus whereas the responsibilitie s of the expenses are revealed onto a pie chart. On the other hand, a meagre number of students, 12% and 9% believes that further studies would build job prospects and networking connections.
We can observe that 78% chose the path of higher learning due to their personal passion for knowledge and to achieve professional competence. Rather than a pursuit for financial benefits, it can be suggested that a large majority are mainly driven by a search for a meaningful and fulfilling career path.
In order to achieve that goal, they are primarily responsible for the expenses. The bar chart unveiled that the public perceives 40% of the entire expense should be funded by the student. Due to its external positive effects, the company and the government should take on 35% and 25% of the remaining amount respectively.
An analysis of the bar chart presents that interest in a subject constitutes the main reason why adults choose to study, making up precisely 40% of the total who participated in the survey. Qualifications gaining have also a significant weight at approximately 38% of the total responses. In contrast, adults do not seem to value the possibility of meeting new people as a valid reason to study, as just roughly 10% of the people who took the survey chose this argument. Regarding the way the cost should be shared, there is an even distribution between individual and employer support, as the percentages associated with these two categories only differ by five per cent.
In summary, according to the observed data, adults mainly decide to study to gain further qualifications, and for a personal interest in a subject, and they believe the cost of the studies should be the responsibility of their employers and themselves, not so much of the tax-payers.
It is apparent from the survey results that the majority of people distributed to continue their study due to their love for the subjects and obtaining the degrees.
According to the first chart, passion in subjects has the highest impact on continuing education for adults, with 40% of the total outcome. It is closely followed by the reason to qualify with only 2% difference at 38%. Next, come the following reasons which are helpful for the current job presented at 22% and also to improve prospects of promotion and enjoy studying are about one-fifth of the total. Moreover, individuals who would like to change their jobs are around 13%. Nevertheless, adding new friends is definitely the lowest criterion with just under 10 per cent to this mission.
Furthermore, the second picture represents clear information about the belief how such education costs in every course have to be dealt with. It shows that individuals should manage their tuition fees by themselves as the highest percentage (40%). Other sectors – taxpayers and employers - should bear 25% and 35% respectively, as the surveyed people opinied.
It is clear from the bar graph that the two most important reasons why adults decide to study are 'the interest in the subject' and 'to obtain higher qualifications'. They also think that employer and taxpayers should contribute to support the expense.
The survey demonstrates that 40% of adults study due to their interest in subjects whereas approximately 38% study to gain qualifications. Besides this, enhancing the prospects of promotions and enjoying learning or studying are two other reasons 40% of adults continue their education. Finally, a small percentage of people study to meet people and to change their current jobs (9 and 10 percents respectively). Finally, more than 20 per cent people who enrol in the study because it is valuable for their current job. A person can have more than one reasons to study, as the percentage of choice suggests.
It is further evident from the pie chart that individual should support by proving 40% of their academic fee while taxpayers should share 25% of this cost. Moreover, 35% of the cost should be provided by an employer, according to the participants of the survey.
As an overview, the main reason for adults to study is their interest in subjects. As per their opinions, the individual contribution of money for studies should be higher than that of taxpayers and employers' contribution.
Two primary reasons for continuing education by adults are the interest in a particular subject and to gain qualifications. 40% of adults study because of their interests whereas below 40% consider study as a process to improve their qualifications. Some people (just above 20%) prefer to study because they find it helpful for their current job. Besides, 20% of adults express interests in studies as they enjoy it or it helps them to get promotions. Finally, about 10% of people consider studying as a way to change their job and to meet people.
As per the opinions of the survey takers, four out of ten participants believe that they should support the cost for their course fees while taxpayers should bear this cost is believed by 25% of them. Finally, the rest of them think that the cost should be provided by their employers.
According to the bar graph, the highest proportion, 40% of adults, continue their study due to their interests in various subjects, whereas 38% prefer to gain a further academic and professional qualification. More than one-fifth of these people study for the sake of their jobs and they think that higher education would be beneficial for their current job.
Again, one out of ten adults wants to improve their prospects of promotion through higher studies. Further education is continued by 20% adults solely because they enjoy learning in an academic environment. According to this survey, 12 out of 100 are those who want to enhance their education to be able to change their job and finally, we have 9% adults who just want to meet different people and that is why they keep continuing their education.
Now from the pie chart, we can see that 40% of those adults opine that cost for this education should be supported by the individuals who study. However, another 35% think their office should bear this cost on their behalf. Finally the remaining 25% people are under the impression that taxpayers’ money should be used so that they get free and healthy education from the government.
Overall, adults mainly decide to study for their interests in subject and they are of the opinion that they should finance only 40 per cent of the course fees while the rest should be supported by the employers and the government.
From the bar graph, it can be seen that 40 percent of adults study for their interest in the subject and 38 percent to obtain a qualification. Also, studying proves out to be helpful for the present job by 22% people whereas 20% opt to improve prospects of promotion as well as to enjoy learning/studying. However, only 12 and 9 per cent of adults admit that they continue their study to change their current jobs and meet people respectively.
Furthermore, they think that the cost of their studies should be divided into three categories. The major cost, 40 per cent, should be supported by the individual while 35 per cent by the employer and the remaining 25 per cent by taxpayers.
Overall, it is clear that the main intention to study by adults is their interest in a subject. Also, many of them think that the course fee should be paid by individuals and employers.
In detail, the major proportion of adults (40%) decide to study because they are drawn to a prospective subject. The second most common reason is to gain qualifications that account for around 38% of them. One-fifth of them decide to advance their academic qualifications because of possible promotion and learning new things. Also, a few of them study because they believe that it might be helpful in their workplace. In contrast, just an insignificant proportion of those adults study for networking and job change, 8% and 10 % respectively.
Turning to the pie chart, 40% of adults who took the survey think that the course fee should be paid by individuals, a quarter opines that the money should come from the taxpayers and the remaining 35% believe that it should be supported by their employer.
Report