Graph Writing # 86 - Australian Bureau of Meteorology collects information on the weather
- Details
- Last Updated: Thursday, 05 May 2022 15:50
- Written by IELTS Mentor
- Hits: 239624
IELTS Academic Writing Task 1/ Graph Writing - Diagram:
» You should spend about 20 minutes on this task.
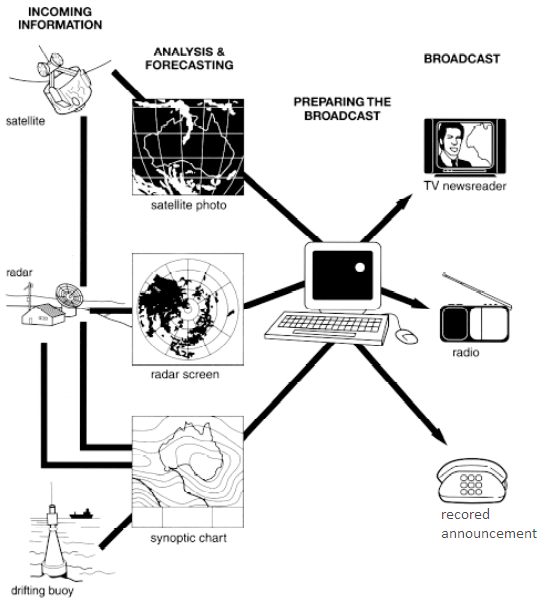
The diagram below shows how the Australian Bureau of Meteorology collects up-to-the-minute information on the weather in order to produce reliable forecasts.
Write a report for a university lecturer describing the information shown below.
» You should write at least 150 words.
Sample Answer 1:
The given diagram shows how the weather information is collected by Australian Bureau of Meteorology to provide accurate and updated weather forecasting. As is observed from the given illustration, the weather information collection is done via satellites, radars and drifting buoys and then analysed before broadcasting them to the public.
As is presented in the diagram, the weather information is collected using three different types of sources namely, satellites, radars and drifting buoys. The raw data collected from satellites is basically satellite photos while radar information is observed from the radar screens and the synoptic charts are yielded from the drifting buoys and these three types of data are fed into a computer system to analyse and prepare the weather news for broadcasting.
After that, the weather, the news is broadcasted in different public media like televisions, radios and telephones. The final information regarding the weather is provided to the public via TV news, radio broadcasting and as a recorded announcement in devices like telephones.
Model Answer 2:
The given figure illustrates the process used by the Australian Bureau of Meteorology to forecast the weather. There are four stages in the process, beginning with the collection of information about the weather. This information is then analysed, prepared for presentation and finally broadcast to the public.
Looking at the first and second stages of the process, there are three ways of collecting weather data and three ways of analysing it. Firstly, incoming information can be received by satellite and presented for analysis as a satellite photo. The same data can also be passed to a radar station and presented on a radar screen or synoptic chart. Finally, drifting buoys also receive data which can be shown on a synoptic chart. In the third stage of the process, the weather broadcast is prepared on computers. Finally, it is delivered to the public on television, on the radio or as a recorded telephone announcement.
[ By - Togrul Nesirli ]
Model Answer 3:
The illustration provides information about the process of collecting current and reliable weather forecasts and then broadcasting this to mass people which are conducted by the Australian Bureau of Meteorology.
As can be seen, this process needs some equipment to gather news forecasts and three main sources, such as satellite, radar, and the drifting buoy is used for collecting weather information.
To begin with, the satellite is used to capture images of Australian weather from the outside of the planet. Meanwhile, radar can give screen pictures while a drifting buoy which is placed on the sea reveals a synoptic chart of the Australian climate.
Subsequently, all of the information is analysed to know the real weather condition in Australia. After that, these data are put on the computer to prepare the report for the public broadcast. People will know the weather forecasts in Australia through various media, in particular, TV newsreader, radio, and recorded announcement.
[ By - Waode Eti ]
Sample Answer 4:
Ways of data gathering, its analysis and weather forecasting, as well as broadcasting methods followed by the Australian Bureau of Meteorology to produce accurate weather forecast, are illustrated in the process flowchart.
As shown in the diagram, the Australian Bureau of Meteorology collects information from different sources, like satellites hovering in space, radar sets positioned at different places on the Earth and drifting buoys anchored to the seabed in the vicinity of the continent. Before forecasting all input data need to be analyzed, using radar screens and synoptic charts. The former is designed on the basis of source materials coming from the satellite and radar sets, whereas the latter is compiled on the basis of the information from all sources mentioned above. As soon as the information analyzed and the forecast is done, it is prepared for broadcasting. Finally, precisely prepared forecast information reaches TV studios, radio stations and places where it can be recorded for further announcement.
[Authored By - Ted Tailor]


The first step is the accumulation of the raw information from the actual site. The collection of information can be done in three ways; through satellite, radar or drifting buoy. The data which was gathered via satellite will be analysed and forecasted through a satellite photo. On the other hand, information assembled from the radar will be interpreted either through a radar screen or synoptic chart -which can also be used in gathering data from a drifting buoy.
Consequently, the information that has been analysed and forecasted through satellite photos, radar screens and synoptic charts will be interpreted in the computer system. Right after being scrutinized by the data processor, the news will be finally ready to broadcast on diverse communication platforms such as television, newspaper, radio and recorded announcements.
The illustration elaborates on how the Australian Bureau of meteorology operates and collects information to produce reliable forecasts; primarily, information gathered from three main pillar devices- namely, satellites, radars, and drifting buoys.
These devices collect and then send different data to the meteorology stations. The data is then analysed and transformed as usable information. For example, satellites are among the latest information providers that capture photos around the globe and transmit data. Similarly, radars and drifting buoys also collect weather-related data and help produce the reliable forecast.
The data received from these sources are processed and transformed into reliable information ready to use and announced to the general public. The reports are sent to TV stations, radio stations and phone companies to be made available to mass people.
Through this process, the Australian Bureau of Meteorology collects, analyse and broadcast proper weather forecast.
In general, weather-related information is collected from different sources and then analysed in a computer system before it is sent to be broadcast in mass media like TV, radio and telephone for the general audience.
It is evident that the Australian Bureau of Meteorology collects weather forecasts every minute by sending satellite photos, radar screens, and symbolic charts to weather experts. Satellite images, signals from radars and synoptic charts from drifting buoys are first analysed to predict the weather condition. these are then fed into a computer system that helps experts prepare reliable weather forecasts. Afterwards, the forecast is sent to different mass and recording media like televisions, radios and telephones so that the general public is made aware of the weather conditions.
Overall, it can be seen that weather information is collected by satellites, radars, and drifting buoys, and these are then analysed and processed before releasing these predictions to the public.
Firstly, satellites are used to get weather information from space and those data are translated into satellite pictorial forms. Similarly, on land, different radars give out signals which are transformed and recorded on the radar screens. Lastly, wave signals picked up by the drifting buoys - embedded in various parts of the oceans and seas - are being analysed into a synoptic chart.
These diverse data sets are then fed into designated computers. These computers analyse the input and make predictions of weather conditions. They are then broadcast on telephones through recorded announcements, as well as on TVs and radios.
It is clear that the whole process has 4 separate stages from collecting and analyzing data to preparing forecast content and publishing them to the media.
In the first step, incoming information is captured by satellites, radar stations or drifting buoys. In the next step, the collected data is analyzed and forecasted to create visuals. There are three types of visuals: photos generated by satellite, screens produced from the information of radar and satellite, and synoptic charts created by all sources of data. In the third step, all results from the analysis and forecasting steps are processed by computers. This step is called “preparing the broadcast”. After having the final content ready to be broadcast, the reliable weather forecast is published to the most popular broadcast channels such as TV newsreader, radio or recorded announcements.
in order for a valid forecast demonstration by the Australian Bureau of Meteorology.
Overall, there are three stages in the generation of the forecast. Meanwhile, the information is collected from three sources such as satellite, radar and drifting buoy.
In the first stage, raw weather data is collected from the satellite, radar and drifting buoy. This data is then analysed for the forecast. Information gathered from the satellite photos, radar screens and synoptic charts are fed into a computer system. The computer system helps further analyse the data and then make it ready as a broadcastable forecast. Now, the collected materials are ready to be broadcasted in three media: TV, radio and recorded announcement over the phone. TV newsreaders read the weather forecasts where the radio announcements also let the mass people know about it. Finally, the weather forecast is also made ready for the telephone users as recorded announcements.
In general, the weather information is collected from three different sources, producing three different outputs for analytical and forecasting purposes. Next, the three different outputs are used in order to get ready for public dissemination through three different media channels.
Regarding the analysis and forecasting stage, it basically harnesses the outputs produced by three different sources. The satellite imagery and radar screen are the special products of the satellite and the radar, respectively, while synoptic charts are produced by all sources, including drifting buoy.
Before broadcasting the forecast, the previously mentioned information products are used as inputs for the broadcast preparation stage. At this point, the products are being set up in a particular way to get ready to go public via three different channels, which are television, radio, and recorded announcement.
In general, what stands out is that information is collected by three sources, namely satellite, radar and drifting buoy, which send the data for further processing before delivering the news to the public.
The process begins when the rotating satellite in the orbit, radar and drifting buoy in the ocean obtains primary information as satellite photos, radar screen and synoptic chart, respectively. However, satellite and radar can give insight into synoptic charts as well. When all the data is collected, they undergo an analysis as well as forecasting.
In the next stage, these processed pieces of information are sent to a computer where it gets prepared for the broadcasting. Finally, the Australian people receive the latest weather forecast from TV newsreader, radio or a recorded announcement from the telephone.
It can be clearly seen that the process of collecting information demands different steps. Satellite, radar and drifting buoys are the most popular and frequently used tools for collecting data to prepare the forecast.
According to the chart, the Australian Bureau of Meteorology relies on satellites, radars and drifting buoys to collect initial data. For satellite, the information turns into satellite photos, which are analyzed by bureau specialists. The information from radar transforms into the radar screen, and one from buoys turns into the synoptic chart. After collecting data, specialists then analyze it on computer devices. In this stage, the forecast is prepared to be broadcast to the mass people. The prepared forecast on weather is then sent to television, radio and recording devices for the citizens all around the country.
To begin with (looking at the first stage), the satellite is used to transfer information from the outside of the planet as a picture. Meanwhile, the radar station can also pass the same information as a radar screen. Finally, synoptic charts are yielded from the drifting buoys and these three types of data are fed in a computer system to analyze and prepare the weather news for broadcasting.
Subsequently, in the third stage, all information is prepared to know the real weather condition in Australia. And after that, it is delivered to the public on television, on the radio or as a recorder telephone announcement.
Report