Graph Writing # 112 - Number of visitors to three London museums between June and September 2013
- Details
- Last Updated: Tuesday, 28 July 2020 12:30
- Written by IELTS Mentor
- Hits: 113102
IELTS Academic Writing Task 1/ Graph Writing - Line Graph:
» You should spend about 20 minutes on this task.
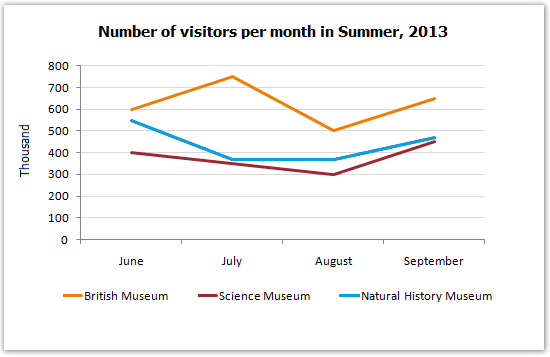
The line graph below gives information about the number of visitors to three London museums between June and September 2013.
Summarise the information by selecting and reporting the main features, and make comparisons where relevant.
» Write at least 150 words.
Sample Answer:
The given line graph compares the London museum visitors from June 2013 to September 2013. As is presented in the given data, British Museum was the most popular museum in terms of visits and there were some fluctuations in the number of visitors for the given four months.
As is observed from the line graph, British Museum was the most visited museum in London in 2013 and in June 2013, around 600 thousand people visited this museum. In the same period, there were around 550 thousand visitors in the Natural History Museum whereas 400 thousand visitors visited the Science Museum at that time. In the next month, the visitors of British museum increased to 750 thousand, reaching at the highest point, while the visitors of other two museums decreased. With some fluctuations in the next two months' visitors, the visitor numbers of British Museum reached to over 650 thousand in September 2013 whereas the number of other two museums also started increasing than the previous month and was around 450 thousand.
In conclusion, the British Museum had the highest visitors for the given period and the visitors’ number for all the three museums fluctuated throughout the given four months of the year 2013.


It is clear that the number of visitors to the British Museum was the highest over the period. Fluctuations were seen among all three museums. However, British Museum and Science Museum showed an upwards trend in the number of visitors while Natural History Museums displayed a downwards trend.
In June of 2013, 600 thousand people visited British Museum and the figure increased to its peak of about 750 thousand in July. The number of visitors sharply declined to 500 thousand in August. However, there was a growth in number to approximately 650 thousand in September.
Science Museum and Natural History Museum exhibited similar trends. Although the number of visitors dropped from 400 thousand and 550 thousand respectively in June to 300 thousand and around 380 thousand in August, the figures ascended to about 450 thousand congruously.
Overall, the Natural History Museum experienced a downward trend in its number of visitors, while the visitor number in the Science Museum and the British Museum showed a slight upward trend. Moreover, despite some fluctuations, the British Museum was the most popular museum of the three during the entire period.
It is apparent from this graph that 600 thousand people visited the British Museum in June, outracing the others. It peaked at almost 750 thousand in July and, in August, sharply fell back to 500 thousand again. Climbing by 150 thousand, nevertheless, the figure recovered the drop in September. The number of visitors to the Natural History Museum and the Science Museum, starting at 550 and 400 respectively, steadily went down until the mid-July. The former remained constant at just below 400 thousand, while the latter continued to go down and reached 400 thousand during the following one month. After mid-August, both grew to the same point of 450 thousand.
Overall, British Museum in London attracted more people when compared to the other two museums called Science Museum and Natural History.
It is clear from the data that from June to July, visits to British Museum increased greatly from 600 thousand to approximately 750 thousand, wherein, this number suddenly dropped in August and finally in September it reached 650 thousand. Moving further to the figures of Science Museum and Natural History Museum, it is observed that in the first two months, visitors to Science Museum initially reduced and then almost plateaued at nearly 350,000. In July its guest number was 400 thousand. However, the visitors' number to Natural History Museum inferred a slow fall to 300,000. Lastly, between August and September, the number of spectators to both the museums referred to a gradual elevation.
Generally speaking, the British Museum, among the given three, received the highest visitors during the period.
As the data suggest, in June 2013, 600 thousand visitors went to the British Museum which was higher than the number of visitors in two other museums. In this month, the Science Museum was visited by about 550 thousand people and finally, the Natural History Museum got 400 thousand visitors. It is obvious that the numbers of observers in the Science Museum plunged in July and August but reached 470 thousand in September. Similarly, the visitors to the Natural History museum declined monotonously until August and reached to 300 thousand as nadir and spouted till 450 thousand at last in September. On the other hand, the visitor trend of the British Museum was different in July as it received more than 750 thousand people then. Its spectators jumped rapidly and reached to 750 thousand as the summit and slumped dramatically to 500 in August. It is noteworthy that the number of viewers to the museums in September showed an upward trend.
Report