Graph Writing # 129 - Quarterly sales figures of Woodward chocolate bars for 2010
- Details
- Last Updated: Monday, 17 August 2020 17:49
- Written by IELTS Mentor
- Hits: 35656
IELTS Academic Writing Task 1/ Graph Writing - Column/ Bar Graph:
» You should spend about 20 minutes on this task.
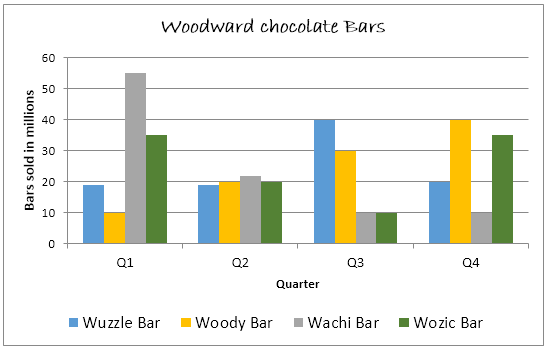
The graph below shows the quarterly sales figures of Woodward chocolate bars for 2010.
Summarise the information by selecting and reporting the main features, and make comparisons where relevant.
» You should write at least 150 words.
Sample Answer:
The provided bar graph shows sales data of Woodland chocolate for the year 2010. As is observed from the given data, Wachi Bar was the most sold chocolate bar in the first quarter of the year while the popularity of Woody bar increased over the time for the given year.
According to the given bar graph, from January to March around 19 million Wuzzle chocolate bars were sold in Woodland. During this period Wachi chocolate bar was the most sold chocolate which was sold more than 55 million bars. The Wozic was the second most sold chocolate bar during this first quarter with more than 45 million sales volumes. The woody bar was the least sold item for this quarter with only 10 million sales. In the second quarter, the sales volume for all these four chocolate bars were around 20 million. Interestingly in the third quarter, both Wachi and Wozic chocolate sales volume decreased to 10 million while the Wuzzle and Woody bars’ sales increased to 40 and 30 million respectively. In the final quarter, the sales volume for Wachi chocolate bar remained unchanged as it was in the third quarter while the Woody bars’ sales volume increased by 10 million compared to the previous month. In this final quarter, the Woody bar was the highest sold chocolate type and the sales volume of this bar increased throughout the year. The Wachi bar and the Wozic bar were sold around 20 and 35 million in the final quarter.
In summary, there was a common pattern of the sales volumes of the four chocolate types for the year 2010 except that the sales amount of Woody bar increased in each quarter while this volume decreased for the Wachi bar.


Overall, sales of Woody chocolate bars increased while those of Wachi declined. Additionally, in the first quarter, the sales volume was the highest.
To begin with, 55 million Wachi bars were sold from January to March. This figure far exceeded the remaining types of chocolate bars in this quarter, whose sales varied between 10 and 35 million. And together, 120 million chocolate bars were sold just in this 3-month's period.
Then, in the next quarter, the sales of all 4 types of bars were around 20 million. This meant a sharp decrease in Wachi bars sales, by 35 million. During the same time, Wozic bar sales also decreased but less noticeably while an exactly 2-fold increase can be seen regarding sales of Woody bars.
Sales of Wachi bars furtherly dipped to 10 million and remained at this point by the end of the year. In sharp contrast, Woody bars became a best-seller, with 40 million sold between October and December, as the sales rose stably every quarter. For Wuzzle and Wozic, sales of these 2 types ranged from 10 to 40 million per quarter as observed in the last 6 months of the year. Sales of the former type declined while the exact opposite was true for the latter one.
And finally, it is worth noticing that the numbers of chocolate bars sold in the second, third and fourth quarter were all somewhere from 80 to 90 million.
Report