Graph Writing # 25 - Estimated sales of gold in Dubai for 12 months
- Details
- Last Updated: Monday, 20 July 2020 16:07
- Written by IELTS Mentor
- Hits: 169982
IELTS Academic Writing Task 1/ Graph Writing - Line Graph:
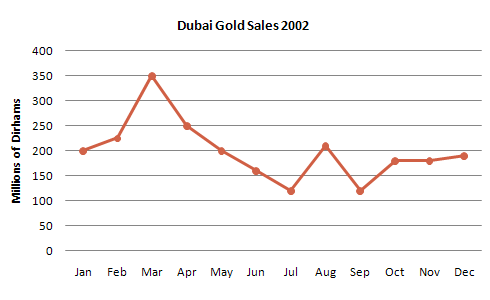
The line graph shows estimated sales of gold in Dubai for 12 months in 2002 in millions of Dirhams.
Write a report describing the information in the graph below.
» You should write at least 150 words.
» You should spend about 20 minutes on this task.
Model Answer 1:
The line graph shows monthly gold sales amount in Dubai throughout the year 2012. The sales amount is given in million Dirhams for every month in 2012. A glance at the diagram reveals that in March the sale amount was highest and average monthly sale of gold was between 100 and 200 million Dirhams.
According to the line graph, total sales of gold was 200 million Dirhams in January 2002 in Dubai and this amount rapidly increased in the next two months. In March, the sales amounted 350 million Dirhams, the highest in the year but afterwards, the sales amount steadily declined till July when the gold sale was recorded at just over 110 million Dirhams. August’s gold sale went abruptly higher, over 200 million but it then dropped suddenly to 110 million again. Sales of gold climbed in the next month, October but remained almost stable for the rest of the year at around 170-180 million Dirhams. At the end of the year, Dubai gold sale was recorded at approximately 185 million Dirhams, almost same as it was at the beginning of the year.
Sample Answer 2:
The given line graph shows data on Gold sales in Dubai from January to December of the year 2002. As is presented in the illustration, the highest amounts of sales were done in March and lowest sales were in July and September.
As is presented in the line graph, initially in January 2002, two hundred millions of Dirham Gold was sold in January and this amount kept increasing for the next two month and in March it reached to 350 million which is the largest amount throughout the whole year. After that, the sales volume keeps declining steadily and reached to 110 million in July. With some fluctuations, the sale amount reached to 200 million in August and finally, in December, it totalled about 200 million.
In summary, Mars was the best month for Dubai Gold sales in the year 2002 and throughout the year the sale volume fluctuated keeping an approximate average of 180 million of Dirham per month.
( This model answer can be followed as an example of a very good answer. However, please note that this is just one example out of many possible approaches.)
Model Answer 3:
The given line graph compares the gold sales in Dubai from January 2002 to December 2002. The sale price is given in million of Dirham and it is evident from the diagram that gold sales in Dubai was highest in March while it was lowest in July & September.
According to the given illustration, the gold sale in Dubai was 200 million Dirham in January in the given year and it increased to around 230 million Dirham in the next month. The highest sale of the gold was in March amounting 350 million. From April to July, the sales amount kept on decreasing and reached to the lowest level in July with just above 100 million Dirham. In August the sale was just above 200 million and after that sales amount of Dubai gold showed some fluctuations. In September the sales amount again reached at the lowest point while at the end of the year, December 2012, the sale was just below 200 million Dirham.


Band 7.5 Sample:
The line chart demonstrates how the sales figure of Dubai Gold changed each month in 2002.
It is obvious that March recorded the highest gold sales while the sales in July and September were the lowest.
A rising trend in Dubai's gold sales could be noticed in the first three months of the year. In January, the gold sales stood at 200 million Dirhams, and this number rose to around 220 in February and surged to an all-year-high of 350 million Dirhams in March.
Between March and July, sales figures dropped significantly - 250 million Dirhams sales was made in April which declined by about 50 million Dirhams every following month for three consecutive months and reached just above 100 million Dirhams in July, the lowest of the year.
While August saw some recovery of the sales figure at around 200 million Dirhams, Gold sales was not able to reclaim the 200 million mark in the last four months of the year. September witnessed again the lowest sales at 100 million Dirhams, and some small fluctuations could be found for the fourth quarter at around 180 million Dirhams of gold sales in Dubai.
Report