Graph Writing # 142 - Average monthly temperatures and the average number of hours of sunshine
- Details
- Last Updated: Tuesday, 25 August 2020 23:45
- Written by IELTS Mentor
- Hits: 177512
IELTS Academic Writing Task 1/ Graph Writing - Line Graph + Table:
» You should spend about 20 minutes on this task.
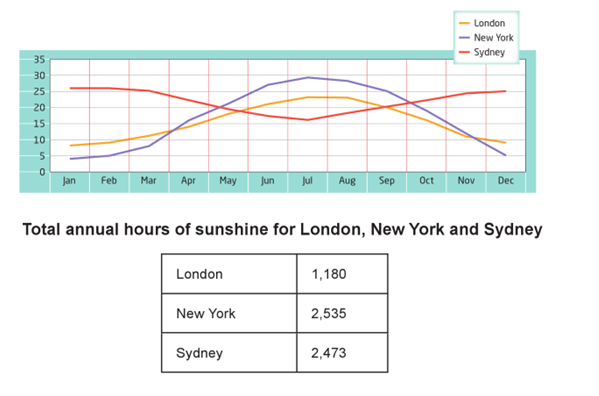
The graph and table below show the average monthly temperatures and the average number of hours of sunshine per year in three major cities.
Summarise the information by selecting and reporting the main features and make comparisons where relevant.
» Write at least 150 words.
Sample Answer:
The line graph illustrates the mean temperature per month, whereas the table demonstrates the hours of sunshine in average in a year in London, New York and Sydney. Overall, it is clear that although London and New York become warmer but the temperatures start to decrease near the end of the year, the opposite trend is true for Sydney.
In January, the temperature in London is higher than New York with figures 8 and around 5 respectively. As the temperatures in both cities continue to rise, the temperature in New York becomes higher than London in middle of March; the figures go up gradually and reach peaks in July (just under 30 and around 23) before showing a downward trend until December with a lower temperature in New York than in London.
Turning to Sydney, the temperature starts to decline from January to July and then rises back in the end of the year with the lowest point just above 15. From the table, it is observed that New York has the highest number of hours exposed to the sunshine (2535 hours) and that was slightly higher than that of Sydney (2473 hours). Total hours of sunshine in London was the least and that was 1180 hours.
[ Written by - Lee Wing Qeen ]


Overall, Sydney had the highest average temperature at the beginning and the end of the year, while New York experienced the lowest temperatures. New York also had the highest annual sunshine hours, while London had the lowest.
At the start of the year, Sydney had the highest average temperature, exceeding 25°C. New York was noted to have the lowest temperature, falling below 5°C, while London was slightly higher at approximately 10°C.
In July, New York reached a peak temperature of below 30°C and recorded the highest annual sunshine hours with an impressive 2535 hours. Sydney experienced a rising trend in temperature, reaching 25°C in December, and had 2473 hours of sunshine. On the other hand, London had the lowest annual sunshine hours, totaling 1180 hours.
Overall, the highest temperature among the given cities is in New York, and the lowest is also in New York as its temperature fluctuates the most. Moreover, the yearly highest sunshine is recorded in New York, and the coldest city among these three is "London".
Firstly, Sydney's highest temperature in January is 26. This temperature remains the same till February. After that, it starts to decrease till July. It reaches 16 and starts to increase and reach 20 in December. While London's temperature is 9 in January, and after that, it starts to increase gradually till August. And it starts to decrease and reaches 10. The lowest temperature of New York in January is 4. After that, it starts to rise till July and decreases after that. It finally reaches just 5 in December.
Secondly, the highest sunshine in New York is 2535 hours yearly. And it is followed by Sydney's yearly sunshine of 2473 hours. The least sunshine and cold are recorded in London with 1180 hours of yearly sunshine.
Overall, New York has recorded high temperatures during the mid-year and Sydney was freezing at the same time. There was a noticeable average number of hours of sunshine per year in New York during the year and London was lowest in this aspect.
Initially, the temperatures in London and New York were below 10 degrees. At the same time, the Climate in Sydney was comparatively very hot. However, gradually the temperatures changed monthly and the situations were entirely reversed by the middle of the year i.e., from May to July. By the end of the year, the initial climatic situations were restored in London, Sydney and New York.
Besides, London has the lowest average sunshine per year which is just above 11 hundred hours. Sydney was in second place with 2473 average sunshine's per year, and New York had the highest sunshine (more than 2500 hours per year) among these three cities.
Overall, the temperature pattern in Sydney was different than that of London and New York.
In details, Sydney had the highest temperature at the beginning of the year which was above 25°C. On the other hand, New York experienced the lowest temperature which was below 5°C. At that time, the temperature in London was slightly higher than in New York - around 10°C. In the month of February, the temperature of London and New York continued to rise whereas the temperatures of Sydney fell until the mid-July. In the month of July, New York experienced a hiking temperature and hit a peak at below 30°C while the temperature of London rose to 23°C. After that, New York hit the peak point of below 30°C. London experienced the same trend during this period. In contrast, Sydney experienced an increasing trend for its temperature in which the temperature increased from above 15°C to touch the point of 25°C in December.
Based on the table, New York had the highest annual sunshine which was 2535 while Sydney and London ranked second and third respectively with 2473 and 1180 hours of sunshine.
Report