Graph Writing # 152 - The percentage of unemployed graduates
- Details
- Last Updated: Tuesday, 25 August 2020 23:56
- Written by IELTS Mentor
- Hits: 56059
IELTS Academic Writing Task 1/ Graph Writing - Bar/Column Graph:
» You should spend about 20 minutes on this task.
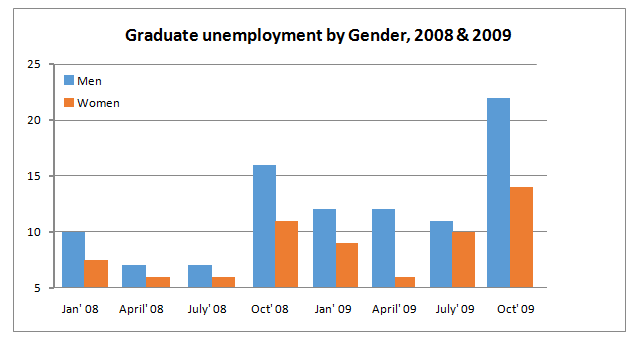
The bar chart below shows the percentage of unemployed graduates, aged 20-24, in one European country over a two-year period.
Summarise the information by selecting and reporting the main features, and make comparisons where relevant.
» Write at least 150 words.
* Data in percentage
Sample Answer:
The bar chart illustrates the unemployment rate among the male and female graduates who are in the age range of 20 to 24 in Europe in the years 2008 and 2009. In general, it is apparent that male graduates had a higher unemployment rate than female graduates over the time frame.
First and foremost, from January to April 2008, a decreasing trend was detected for both men and women. There was 10% of male graduates who were unemployed in January 2008 and dropped slightly to about 7.5% in April and remained constant until July 2008 compared to about 7.5% and just above 5% in January 2008 and April 2008 respectively for women. There were the same percentages of unemployment for both male and female in April and July 2008. A similar trend can be seen in the percentage of unemployed graduates starting from October 2008 to July 2009. The male graduates’ unemployment rate was just over 15% in October 2008 and decline moderately to approximately 12% in January 2009, and reached just over 10% in July 2009.
Interestingly, unemployed female graduate decreases from October 2008 to April 2009 continually before a dramatic increase in July 2009. A sharp rise in the unemployment rate for both genders can be observed after July 2009 and eventually peaked at around 23% for men and just under 15% for female in October 2009.
[ Written by - Lee Wing Qeen ]


Report