Graph Writing # 157 - Time younger and older people spend on various Internet activities
- Details
- Last Updated: Tuesday, 25 August 2020 23:56
- Written by IELTS Mentor
- Hits: 65656
IELTS Academic Writing Task 1/ Graph Writing - Pie Charts:
» You should spend about 20 minutes on this task.
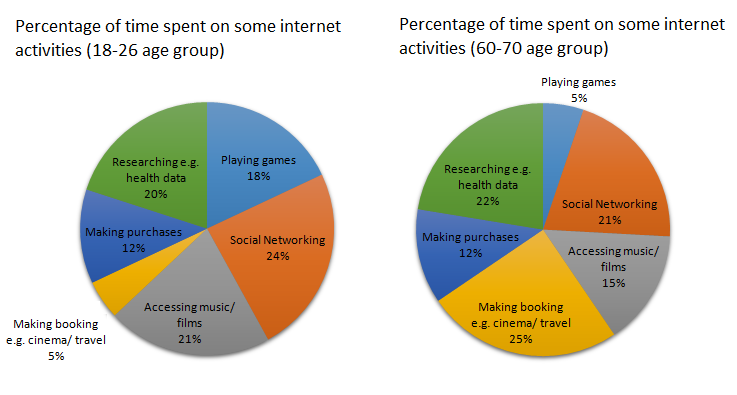
The charts below show the percentage of time younger and older people spend on various Internet activities in their free time (excluding email).
Summarise the information by selecting and reporting the main features and make comparisons where relevant.
» Write at least 150 words.
Sample Answer 1:
The pie charts illustrate the proportion of time people allocate on different internet activities when they are free, divided into two groups: that is youngsters (18-26 group) and the elderly people (60-70 age group). Overall, it is clear that the two age groups have different preferences of internet activities.
First and foremost, the younger age group spends a majority of their time on social networking (24%) compared to only 8% of the time elderly people spend. The older people, however, spend most of their time on making bookings for the cinema ticket or travel (29%) which is almost fourfold then the time youngsters spend on this stuff. Young people tend to access to music or films more than older people (just over one-fifth and 17% respectively).
In addition, young people use three times more in playing online games than the other age group (18% and 6% correspondingly). Interestingly, both the age groups spend approximately the same time for activities like doing research related to the health issue and making purchases online, that is 20% and 14% for the elderly people.
[ Written by - Lee Wing Qeen ]
Sample Answer 2:
The given pie charts illustrate the proportion of free time of young and elderly people used for different internet activities including email services.
It can be seen from the graph that, the youngsters, belonging to 18 to 26 age group, spent their good proportion of 24% of surfing time to carry out social networking. Whereas the elderly belongs to 60 to 70 years age group and they used their 25% quality browsing time to call on cinema or travel booking websites. At the same time, merely 5%of youth's surfing time used for this purpose. Again, both youngsters and old people spent an almost same percentage of time to get into researching purposes. It was 20% and 22% respectively. The most interesting phenomenon had noticed from this pie chart is both groups spent exactly 12% of their browsing time on purchasing online.
Next, elderly spend their 21%of surfing time to call on social networking. Whereas the youth spent an exactly same percentage, that is 21% for access music and films. However, only 15%of elderly surfing time had used for visit music sites. The least interesting elderly online activity was playing games. They spent measure 5%of their browsing time for the same. On the other hand, for youth, 18% time spent for their browsing time used for not other than playing games.
Overall, the most interesting internet activity of youth was social networking. Cinema and travel booking was the favourite online activity of elderly. However, this was the least interested internet activity of youth. Though both are spent different time for various activities, online purchase times of elderly and youth were exactly the same.
[ Written by - Basil Pallath ]


Report