Graph Writing # 168 - Usual water usage by industries
- Details
- Last Updated: Tuesday, 25 August 2020 23:58
- Written by IELTS Mentor
- Hits: 50290
IELTS Academic Writing Task 1/ Graph Writing - Bar Graph:
» You are advised to spend about a maximum of 20 minutes on this task. Write about the following topic:
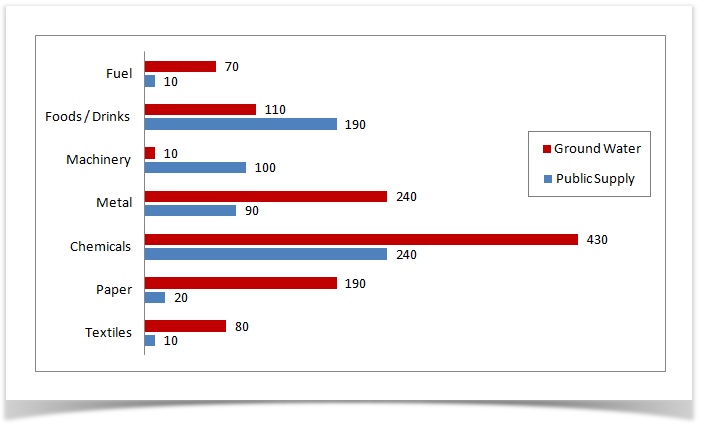
The graph below shows usual water usage (in millions of cubic meters) by industries in some countries in a year.
Summarise the information by selecting and reporting the main features, and make comparisons where relevant.
» You should write at least 150 words.
Model Answer 1:
The presented bar graph demonstrates the average use of water by industries in several countries every year. In general, the highest water usages could be seen in chemical industries while fuel industries spend the least water supply.
Looking at the details, the chemical industry requires about 430 million of cubic meters of ground water and 240 million of cubic meters of public supply. This figure is accounted as almost twice higher than other industries, for instances, meal/beverages, metal and paper industry which spend only 110, 240, and 190 million cubic meters of ground water use respectively. Metal and paper industries utilise about 90 and 20 million of cubic meters of public supply respectively and they are reckoned as almost two and seven times lower than water usage quantity for the chemical industry.
In contrast, fuel industry consumes the lowest amount of water. It only pertains a figure of 70 million of cubic meters of ground water, approximately 3 times lower than water usage for the chemical industry. Meanwhile, due to public supply, both fuel and textiles industries consume a very small amount of water which is 10 million of cubic meters, almost 24 times lower than water demand of the chemical industry.
[ Written by Linda ]
Model Answer 2:
The supplied bar graph reveals the utilisation of water every year by different industries in several countries. The usage of water is categorised into two sources which are ground water and civic supply.
To begin with, some industries use the vast consumption of soil water in huge quantity. It starts from 430 million of cubic meters for chemicals as the highest consumption, and then it is followed by metal and paper which are 240m and 190m consumption respectively. Subsequently, other businesses also consume high figure of soil water than public supply namely fuel and textiles- both of it spend 80m and 70m in a row. Meanwhile, machinery industry has the lowest consumption of ground water which is just 10m.
There are, however, some businesses which prefer public supply than ground water. Food and drinks are the great deals on the usage of common supply water. The lowest consumption of public water comes from textile and fuel industries which are similar in number- 10m for both.
[ Written by Waode Eti ]
Model Answer 3:
The provided graph describes the yearly water consumption from ground water and public supply by 7 manufacturers in some country. The unit is measured in millions of cubic meters.
Overall, the ground water usage is far more than public supply in most industries. Both of water supplies are mostly used in the chemical industry while the least consumption could be observed in textile and fuel industries.
Looking at the detail, the chemical manufacturing requires 430 million m3 of ground water which is approximately twice than the water consumption in metal and paper industries. In this area, public water is also used highly, contributing 240 million m3 which is almost three times as many as metal industries’ water usage. Meanwhile, the company that uses less water is fuel and textiles and each of them only needs 10 million of public water and over 70 million for ground water.
Food and drink companies have more demand for public supply than ground water supply, gaining 190 million m3 as opposed to 110 million from ground water. It is also true for the machinery comprises that consumes 100 million cubic meters of public water supply which is 10 times higher than the quantity of ground water.
[ Written by Marhamah ]
Model Answer 5:
The provided bar graph compares the average ground and supply water consumptions in seven different industries in several countries in a year. In general, those industries use more groundwater than supply water and the chemical industry is the highest water consumer.
Looking at the details, the chemical industry requires about 430 million cubic meters of ground water and 240 million cubic meters of public supply water. This figure is accounted as almost twice higher than other industries, for instances, meal/beverages, metal and paper manufacturers utilise only 110, 240, and 190 million m3 of ground water and in addition, 190, 90 and 20 million m3 of public supply water every year respectively. Metal and paper industries are reckoned as almost half and one-twelveth water users respectively than the chemical industry.
In contrast, fuel and textiles industries utilise the same amount of water and they are the lowest water consumers with pertaining figures of 70 and 80 million m3 per year of ground water respectively and with the similar quantity of public supply water of 10 million m3. Finally, the machinery industry consumes the least ground water of 10 million m3 and 100 million m3 public supply water which is slightly higher than the public supply water use of the metal industry.
[ Written by Jean D]
Model Answer 6:
The provided bar graph compares the water consumptions of seven different industries in a year in several countries. These industries use both the ground water and the public supply water and it is evident that the chemical industry requires the highest quantity of water while fuel and textile industries use the lowest quantity of water.
As is obvious from the illustration, the highest water consumption of both ground and supply water is done by the chemical industry – 430 and 240 million cubic metre ground and supply water respectively. The metal production uses the second largest quantity of ground water, 240 million m3 while their supply water consumption is lower than food and drink industry. Machinery and food/ drink industries use more public supply water than the ground water. The water spendings by the fuel and textile industries seem to the lowest with 70 and 80 million m3 ground water and 10 million supply water for each industry.
[ Written by Emma L]
Sample Answer 7:
The supplied illustration elucidates the water consumptions in seven different industries breaking down the figures for ground and public supply water. As is obvious, chemical industries use the largest portion of water while water consumption in fuel sector is the lowest.
As is presented in the line graph, chemical, metal, paper, fuel and textile industries utilise more ground water than public supply water while food & beverage and machinery sectors do the opposite. The chemical industry is the largest consumer of both ground and supply water, 430 and 240 million cubic meters respectively. Metal industry, similarly, requires 330 cubic million water and 90 of it is supply water. Foods and drinks producers need 190 cubic million supply water and the rest of the industries do not use supply water that much. The lowest amount of water is required by the fuel industry while it is almost the same in textile sectors. Finally, machinery producers heavily rely on public supply water though they use only 10 cubic million ground water.
[Written by - Sara]
Sample Answer 8:
The bar chart compares the public water and groundwater consumptions in 7 industries. Overall, it can be seen that chemical industry uses the biggest volume of water. Moreover, almost all industries require groundwater than public supply water.
In detail, chemical industry utilizes 670 million cubic metres water- 430m of this is from the groundwater and the remaining is from the public supply. This volume is less than half in the metal industry, 240 million and 90 million cubic metres groundwater and public supply water respectively. Textile, papers and fuel industries, on the other hand, consume the least volume of water from the public supply. To be specific, only about 10-20 million cubic meter water is consumed by these industries from public supply while 70-110 is from groundwater.
In contrast, food and drinks industries consume more water from the public supply, 190 million cubic metres while only 110 from groundwater. Finally, machinery industry utilises 110 million cubic metres water of which 100 is public supply water.
[Written by - Alex D.]


Overall, it is clear that the highest amount of water used is observed in the chemical industry in both categories, whereas it is lowest for the fuel industry.
To commence with, the maximum consumption of groundwater, as well as water from a public supply, is made by the chemical industry which is accounted for 430 and 240 million cubic meters respectively. In terms of metal and paper factories, a difference of 50 million cubic meters between ground and public water consumption is observed. Moreover, the quantity of water which is used by machinery, fuel, textile, and food/drinks industries ranged from 10 to 110 million cubic meters.
Probing further, water provided to industries from the public supply is used at the lowest amount in fuel and textile along with paper industry which is recorded 10 million cubic meters more than these two factories. The manufacturing site of machinery recorded a water usage of 100 million cubic meters which is, interestingly, an amount of gap between food/drink and metal industry.
As the graph suggests, the chemical industry uses a total of 670 million cubic meters of water, and more than one-third of it comes from the public supply. The metal industry also consumes 240 million cubic meters from groundwater, but the figure regarding public supply water stands at only 90 million. Meanwhile, textile and fuel industries use the lowest amount of water, each under 100 million, and it is worth noticing that their groundwater consumptions are similar - 10 million cubic meters.
Both food and drinks and machinery activities expend more water from the public supply. In details, the former utilizes a total of 300 million cubic meters, with 110 million of which come from groundwater, while the machinery industry's usage of groundwater is 10 million, one-tenth that of public supply.
Report