Graph Writing # 183 - Results of a survey of a new shopping complex in Auckland, New Zealand
- Details
- Last Updated: Wednesday, 26 August 2020 00:00
- Written by IELTS Mentor
- Hits: 73948
IELTS Academic Writing Task 1/ Graph Writing - Table + Pie Chart:
» You are advised to spend about 20 minutes on this task.
The tables and pie chart show in percentage terms of the results of a survey of a new shopping complex in Auckland, New Zealand.
Summarise the information by selecting and reporting the main features, and make comparisons where relevant.
» You should write at least 150 words.
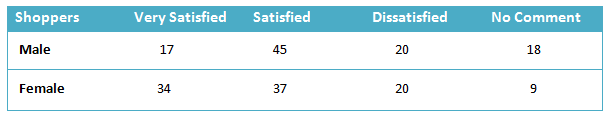
Shops
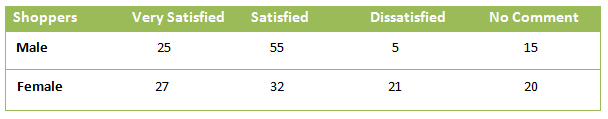
Restaurants
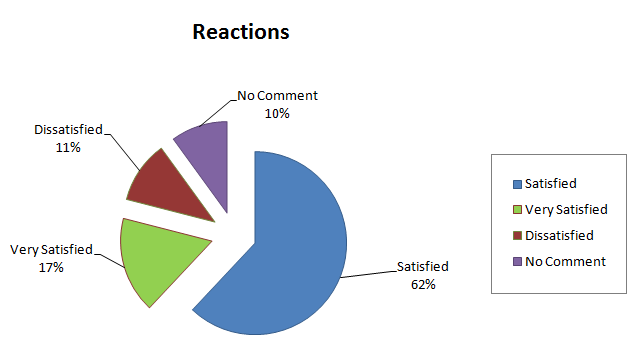
Design
Model Answer 1:
The provided charts show how people felt about a new shopping complex in Auckland, New Zealand (regarding its shops, restaurants and design).
Overall, larger proportions of participants were satisfied or very satisfied with the shopping mall than those who were dissatisfied or had neutral opinions.
To begin with, 17% of men participants said that they were extremely pleased with the shops and this figure for female shoppers was exactly twice as much. At the same time, 45% men referred to their experience as satisfactory, which was 37% for females shoppers. One in five men were dissatisfied about the shops and the same proportion of women shared this view as well. Moreover, 18% male and 9% female did not make any comment about their experience of shopping.
Regarding restaurants, 20% of all women had neutral opinions, slightly greater than 15% of the opposite gender. Additionally, 21% of women shoppers were dissatisfied with restaurant quality and service. But, over 50% of men were satisfied and exactly a quarter was very pleased. On the other hand, above 30% of women felt content and less than 30% felt very pleased.
Finally, the pie chart shows that 62 per cent of all interviewees were satisfied with the design of the shopping mall, and 17 per cent were very satisfied. On the other hand, the proportions of those who were not pleased or had no comments ranged between 10 and 11 per cent.
[Written by - Nguyen Thuong Vu]
Sample Answer 2:
The tables show the satisfaction level of survey participants about the quality of shops and restaurants of a new shopping plaza in Auckland, New Zeland while the pie chart depicts how satisfied they were about the design of this shopping complex. Overall, more men thought that the restaurant was good than that of females while a majority of the shoppers said that they liked the design of this mall.
According to the given illustration, around half of the male survey takers were satisfied with the quality of the shops while 17% of them were very satisfied. On the other hand, over two-thirds of the females said that they were either satisfied or quite satisfied with the stores. Exactly One-fifth of the males and females were dissatisfied with the shops. Now regarding the restaurants, more than half of the males opined that they were satisfied with them while a male out of four was more than satisfied. The objection level of the men about the restaurant was quite ignorable, only 5% to be precise, and this percentage was slightly less than one-fourth of the dissatisfied females with the restaurant quality. A few participants did not comment on the shopping complex's shop and dining quality which ranges from 9 to 20 percentages for males and females.
More than six participants out of every ten expressed their satisfaction with the design of this shopping mall while exactly 17% were very contented about it. One in every ten people did not comment on the design while a very similar proportion of people showed their dissatisfactions.


Report