Graph Writing # 190 - Rating for a hotel's customer service
- Details
- Last Updated: Wednesday, 26 August 2020 00:02
- Written by IELTS Mentor
- Hits: 36619
IELTS Academic Writing Task 1/ Graph Writing - Pie Chart:
» You are advised to spend about 20 minutes on this task.
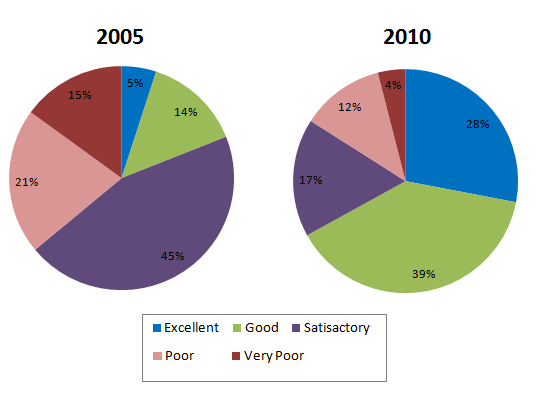
The charts below show the results of a questionnaire that asked visitors to the Parkway Hotel how they rated the hotel's customer service. The same questionnaire was given to 100 guests in the years 2005 and 2010.
Summarise the information by selecting and reporting the main features and make comparisons where relevant.
» You should write at least 150 words.
Sample Answer 1:
The pie charts show the satisfaction levels of guests of the Parkway hotel regarding its customer service in 2005 and 2010. Overall, in 2010, the percentages of people who were contended about the customer service quality of this hotel increased considerably than that of 2005.
Now turning to the details, in 2005, almost every visitor out of five opined that the customer service of Parkway hotel was poor while 15% thought that it was very poor. Roughly half of the survey takers expressed their satisfaction regarding their experience with the hotel's guest service and 14% said that it was good. One out of twenty such visitors were quite satisfied and they thought that the service was actually excellent.
Now getting back the survey result in 2010, it is evident that the percentages of happy guests out of 100 who expressed their opinion soared than that of five years earlier. 28% of them thought that the service was excellent which was around 6 times higher than the poll result of this same category in 2005. Guests who thought that the service was good accounted for 39, a great increase than that of 2005. Finally, the ratio of guests who were dissatisfied with the hotel's guest service decreased considerably as well.


In 2005, 36 out of 100 guests felt that hotel service was either poor or very poor, but in 2010 only 16 customers believed the same. The percentage of participants who considered the hotel service to be excellent increased more than five-fold to become 28% in 2010. In contrast, the number of guests that had very poor opinions of the hotel reduced by 11%, after having been 15% in 2005.
The graphs also show that 'good' and 'satisfactory' feedbacks saw opposing trends. The former increased to just under four out of ten, while the latter went down to 17%, slightly over one-third when compared with neutral views towards the hotel in the year 2005. It is worth noticing that guests participating in the questionnaire generally had satisfactory opinions in 2005 and good feedbacks in 2010.
As it can be observed from the diagrams, only 45 of 100 visitors classified the hotel’s services as satisfactory in 2005. This number is even lower in excellent and good ratings, 5 and 14 per cent respectively. Customers who expressed the quality of services as poor was 21% and as very poor 15%. In 2010, as could be suggested by the results, the hotel would have undergone some improvements as more happy customers could be found in this year.
After 5 years, 28 visitors of a hundred qualified the hotel as excellent. The good rating almost trebled, reaching 39%. All other ratings decreased to 17% in satisfactory, 12% in poor and, just 4% in very poor.
Overall, as the evaluation rates presented better results, it is clear that the Parkway Hotel improved the quality of its services. Therefore, customers recognised the improvement and, they got more satisfied with the provided experience.
Report