Graph Writing # 200 - Men and women smokers in Bhutan from 1960 to 2000
- Details
- Last Updated: Wednesday, 26 August 2020 00:03
- Written by IELTS Mentor
- Hits: 18029
IELTS Academic Writing Task 1/ Graph Writing - Line Graph:
» You should spend about 20 minutes on this task.
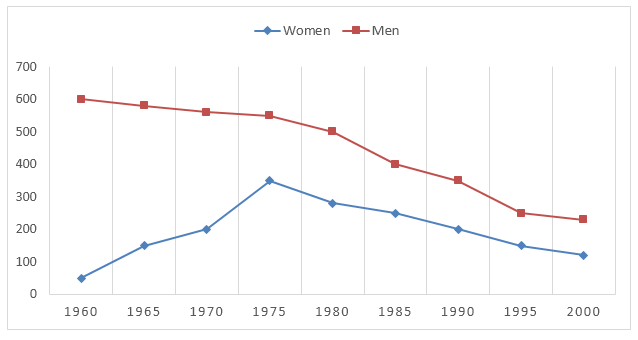
The line graph below gives information about men and women smokers in Bhutan from 1960 to 2000.
Summarise the information by selecting and reporting the main features, and make comparisons where relevant.
» You should write at least 150 words.
Men & Women Smokers in Bhutan (per 1000)
Model Answer 1:
The diagram compares the male and female smokers in Bhutan and shows the smoking trend among the people of Bhutan over a 40 years’ period commencing from 1960. As an overall trend, the percentages of male smokers decreased after 1980 while the ratio of female smokers increased over the given period.
As can be seen in the given line graph, about 60% Bhutanese male smoked in the 1960s while the percentage of female smokers at that time stood at only around 5%. Male smokers’ ratio remained almost the same till 1975 while women smokers soared. Over the time, the percentage of men who smoked gradually decreased and in 1995, four hundred men out of a thousand in Bhutan were smokers. The ratio of female smokers in this year also reached the same level of male smokers and this was a significant increase in female smokers. In the year 2000, approximately 500 people smoked and the number of male and female smokers were almost the same in this year.
Sample Answer 2:
The line graph compares the male and female smokers in Bhutan between 1960 and 2000. Overall, the smoking rates among men and women clearly declined over the time and the ratio of male smokers decreased while the opposite was true in the case of female smokers.
In 1960, six hundred men out of 1000 were smokers. This number dropped gradually to 500 by 1980 and continued to fell till 1980. Afterwards, this trend accelerated and the ratio of Bhutanese male smokers plunged to just over 20%. On the contrary, the ratio of female smokers in 1960 was quite low. But in five years, the female smokers’ percentage climbed to around 15 and increased steeply to over 30%. Afterwards, the female smokers’ percentage is Bhutan dropped gradually till 2000 when around 2 out of ten females smoked. Initially, in 1960, the gap between the men and women smokers was huge but over the time this gap reduced and almost a similar percentage of females and males in Bhutan smoked.


Overall, it is observed that men smoker were higher in number than women smokers throughout the period. Another look at the graph suggests that smoking rates saw a decline over time. More specific information will be summarized below.
To begin with, 60 per cent of all Bhutanese men had the habit of smoking in 1960, which was 12 times the ratio of women in the same year. For the next 15 years, the number of men smokers saw a slight drop to 550 per 1000 while the figure for women sharply increased by 7-fold.
From 1975 to 2000, the pattern dipped dramatically for both genders. In detail, by the end of the given period, the ratios of Bhutanese male and female smokers were 250 and 150 in every thousand, respectively. It is also worth noticing that the gap between male and female smokers, in the end, was narrowed down to one-fifth of that in 1960.
Report