IELTS graph 225 - Main reasons for university education
- Details
- Last Updated: Wednesday, 26 August 2020 00:13
- Written by IELTS Mentor
- Hits: 12474
IELTS Academic Writing Task 1/ Graph Writing - Bar/Column Graph:
» You should spend about 20 minutes on this task.
The chart below shows the main reasons for university education among people of different age groups, based on a survey conducted in 2008, and the percentages of students who got support from their employers in this year.
Write a report for a university lecturer describing the information in the charts below.
Write at least 150 words.
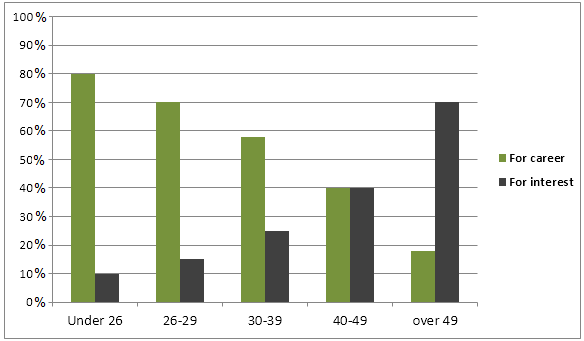
Reason for university education according to age of students
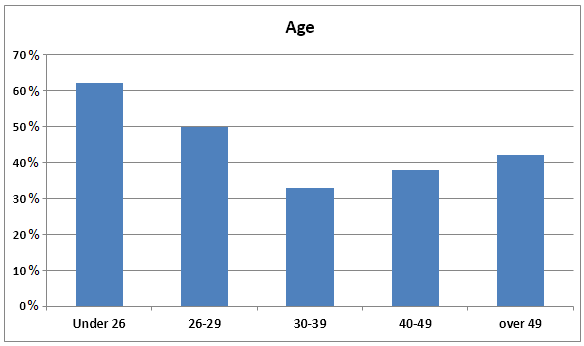
Employer support, by age group (Time off and help with fees)
Sample Answer:
The graphs illustrate two main reasons for people from different age groups to pursue the university education and the ratio of tertiary pupils who got backings for their study from their employers. The data was taken from a survey carried out in 2008. Overall, younger people mostly studied in university for career preparation while it was personal interest for the people over 49 years old. Besides, younger people got more support from their employers than the aged people did.
The first column graph reveals that eight out of ten university students below 26 years old studied for a better career. A same percentage of students, 70% to be exact, from 26 to 29 had the same reason for tertiary education. Interestingly, only around 10% of these students brought up ‘interests in study’ as a reason for their academic involvement. Pupils from 30 to 39 years also thought about the career while taking university courses. Interestingly, 40-49 age group was equally divided for their reasons to study – career and interest. Finally, 70% aged people studied due to their interests rather than jobs.
Based on the second graph, university students got help from their employers basically in two forms – time off and sharing of tuition fee. It is worth noticing that young students got more support from their offices than the aged employees. Over 60% younger students received help from offices while 30 to 40% students from 30 plus age groups had been able to manage support from their employers.


Report