IELTS graph 232 - Workforce profile at the top management jobs in South Africa
- Details
- Last Updated: Wednesday, 26 August 2020 00:15
- Written by IELTS Mentor
- Hits: 22292
IELTS Academic Writing Task 1/ Graph Writing - Pie Chart + Bar Graph:
» You should spend about 20 minutes on this task.
The charts below show the workforce profile at the top management jobs by ethnicity and race in South Africa based on a 2015/16 report.
Write a report for a university teacher describing the information shown in the diagrams below.
Write at least 150 words.
Workforce profile at Top Management level by race in SA
Workforce profile at Top Management level for public and private sector by race in SA
Model Answer 1:
The pie chart compares the South African top management workforce scenario based on different races and ethnicities while the bar graph depicts the same ratio in the public and private sectors. The data is taken from a report published in 2015/16. It is evident that top management positions in South Africa are white dominant and whites are over-presented in private job sectors while the Africans occupy the majority of top positions in public sector jobs.
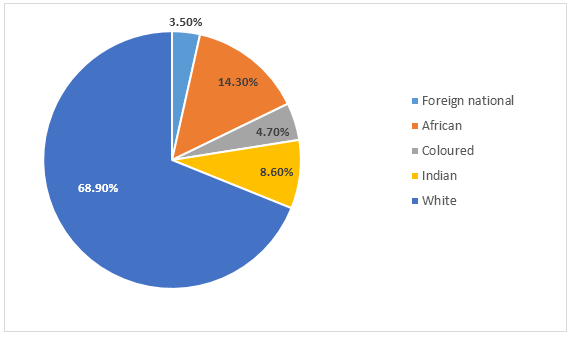
The pie chart reveals that whites are noticeably over-presented in the higher job positions in South Africa as they accounted for over 68% of all top management jobs compared to only 4.7% and 14.3% Coloured and Africans in such positions. Indians represent just over 8.5% of this workforce while foreigners work in 3.5% of such top-level positions.
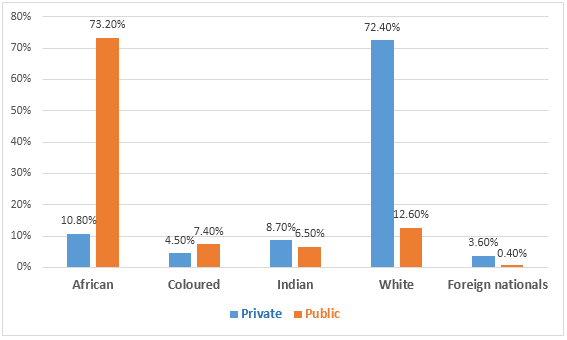
The bar graph depicts that South African top public sector jobs, over 73%, are dominated by African workers while white over-presents the private sector jobs. Every three out of five top private-sector jobs are occupied by whites. Finally, Indians accounted for 8 and 6 percentage private and public job positions, higher than the ratio of Coloured and foreigners' job ratio in top management in South Africa.
Model Answer 2:
The pie chart displays the proportions of top job positions held by people, categorized into five different races, while the bar chart shows the comparison based on races along with public and private sectors. Both charts are based on a report about South Africa in 2015/16.
Overall, white people were dominant in top management level and also held the majority of private sector jobs. On the other hand, public sector had the presence of Africans more than any other nation.
To begin with, about 2 out of every 3 top positions belonged to white people in South Africa during 2015 and 2016. At the same time, Africans accounted for 14.3 percent of those jobs. On the other hand, the remaining three races had their figures of less than 10%. In detail, Indian people represented 8.6%, almost doubled the percentage of coloured people (4.7%), while foreigners only held 3.5 percent of all top level positions.
Regarding the bar chart, Africans took over more than 73% of public job positions and an almost equal figure can be seen for white people in private jobs. Indians hold 8.7 and 6.5 percent of private and public sector job positions, respectively. On the other hand, coloured people and foreigners were around 4% in private sector while the percentage of foreigners holding top postions in public sector jobs was negligible (only 0.4%).
[Written by - Nguyen Thuong Vu]


Report