IELTS graph 233 - Number of applicants and students who were granted admission
- Details
- Last Updated: Wednesday, 26 August 2020 00:15
- Written by IELTS Mentor
- Hits: 18503
IELTS Academic Writing Task 1/ Graph Writing - Bar/ Column Graph:
» You should spend about 20 minutes on this task.
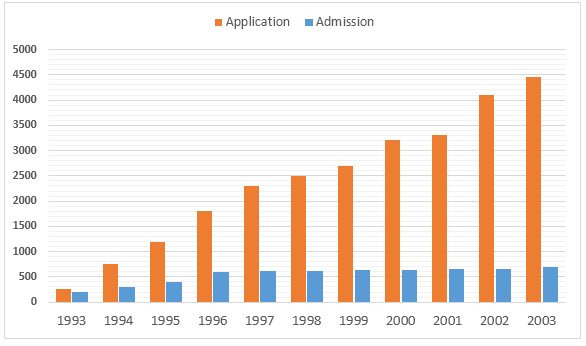
The graph below shows the comparison between the number of applicants and the number of students who were granted admission in a university.
Write a report for a university teacher describing the information shown in the diagram below.
Write at least 150 words.
Application and admission 1993-2003
Sample Answer:
The column graph shows a comparison data between the number of applicants and the number of accepted students in a university over a decade, commencing from 1993. Overall, the number of applicants to this university remarkably increased each year despite a stable acceptance rate by the university authority.
According to the illustration, around 250 students applied for admission to that university and almost 200 of them were granted. Next year, applicants went up to approximately 800 but half of them were rejected. The number of admission seekers to this institute steadily surged and in 2000 more than 3 thousand pupils attempted for admission. However, at this time only 600 of them were granted admission which means 80% applications were rejected in this year. This university accepted around 500 to 700 students each year from 1996 to 2003 despite a hike in the number of candidates. In 2002 and 2003 the university received around 4000 to 4500 application while they approved around 650 students’ admission. To get admitted in this university a candidate had to compete with 5-7 other applicants in 2003.


Report