IELTS graph 240 - Expenditure on children’s sports & participation in sports, UK
- Details
- Last Updated: Monday, 15 April 2019 16:28
- Written by IELTS Mentor
- Hits: 51654
IELTS Academic Writing Task 1/ Graph Writing - Line Graphs:
» You should spend about 20 minutes on this task.
The graphs below show the average monthly expenditure on children’s sports and participation in different sports in the UK from 2008 to 2014.
Summarise the information by selecting and reporting the main features and make comparisons where relevant.
Write at least 150 words.
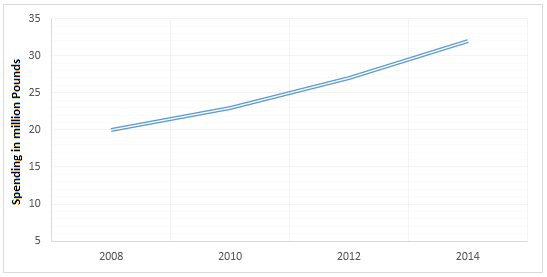
Average monthly spending on children’s sports
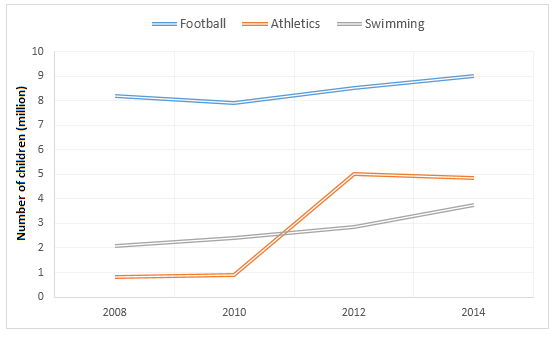
Participation in three different sports
Sample Answer:
The line graphs depict average monthly spending on children’s sporting activities and the number of children who took part in football, athletics and swimming in the United Kingdom between 2008 and 2014. Overall, monthly spending on children’s sports increased over time and football was the most popular sports among British children.
According to the first line chart, 20 million pounds was spent monthly, on an average, in 2008 for British children’s sporting activities which continually went up in the subsequent years. The expenditure in 2011 reached to over 25 million pounds and in 2014, this cost was as high as 32 million pounds approximately.
In 2008, roughly 8 million children participated in football while 1 to 2 million in swimming and athletics, making football the most widely played sports in the UK. However, the popularity of swimming grew and in 2014 roughly 3.8 million participants took this activity. With a steady rise in popularity, athletics was taken up by nearly 5 million children in 2014. Football participants range from 8.5 to 9.5 million during this period, considerably higher than the participants in the other two activities. It is worth noticing that more children participated in these sports in 2014 than they did in 2008.


Overall it can be observed that the monthly spending on children's sport increased over time and football was the most played sport among the participants.
According to the first line graph, the average monthly expense on Children's sports was only twenty million pounds. But from 2008 the spending on children's sport increased continuously and reached just over 30 million pounds in 2014.
Coming to the next chart, in 2008 there were over 8 million participants in football, 1 million in athletics and 2 million in swimming. Football was the most played sport in 2008. The same trend applies in all years from 2008 to 2014. But the least played athletics also became popular over the period. The number of participants in athletics reached half more than half of the participants in football in 2014. Similarly, the number of participants in swimming also increased which was just a million less than athletics in 2014.
Overall, the expenditure increased steadily throughout the period and football was much more popular than the two other activities or sports - athletics and swimming.
To begin with, the average monthly spending by the British for their children's sports in the UK was precisely 20 million pounds in 2008. The figure rose to 23, 25 and 27 million in 2010, 2011 and 2012, respectively. Afterwards, it reached the highest point at the end of the given period to become 32 million pounds in 2014.
Regarding the participation of children in the United Kingdom, the most noticeable feature, as mentioned above, is the dominance of football. In detail, approximately 8 million British children played it in 2008. A decrease that can be seen two years later, which was then followed by a stable rise in the remaining years. The second graph shows that 8.5 million children took part in this game in 2012 and the number increased by half a million in 2014.
As for swimming, 2 million British children participated in it at the beginning of the given period. 6 years later, this figure almost doubled. But the most significant change came from athletics, as the number of children participating in 2014 (5 million) was five times as many as in 2008. As obvious, the years 2010-2012 saw the biggest increase and athletics became the second most popular sports among English children since 2011.
2. Slightly increase in football sports from 2010 to 2012, not a decrease.
Report