IELTS graph 242 - Percentages of US citizens who never married
- Details
- Last Updated: Thursday, 27 July 2017 12:08
- Written by IELTS Mentor
- Hits: 11431
IELTS Academic Writing Task 1/ Graph Writing - Bar/ Column Graph:
» You should spend about 20 minutes on this task.
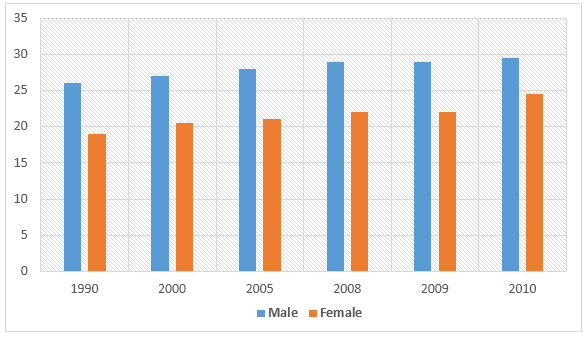
The graph below shows the percentages of male and female US citizens who never married.
Summarise the information by selecting and reporting the main features and make comparisons where relevant.
Write at least 150 words.
% of US Population Who Never Married – by Year and Gender
Sample Answer:
The line graph shows the percentages of American men and women who remained unmarried. The statistical data is presented from 1990 to 2010 and it clearly indicates that the proportion of such Americans gradually increased over the period and unmarried men’s ratio was higher than that of women.
According to the illustration, more than one quarter adult males and one-fifth females were unmarried in 1990. This proportion slightly increased in the next decade when more than 25% male and 21% female were unmarried. The proportion of this single men and women in next five years rose at a higher pace than that of the last decade. Afterwards, the unmarried population in the USA surged more rapidly. Between 2008 and 2010 the ratio significantly increased compared to the previous growth from 1990 to 2005. In just 2 years after 2008, around 30% US males remained unmarried while the proportion of unmarried females was slightly less than that, roughly 24%.
In summary, unmarried adult males’ ratio in America was higher than that of females and not marrying is a trend that accelerated noticeably faster from 2008 to 2010.


Report