IELTS graph 263 - Proportions of people living in different types of houses
- Details
- Last Updated: Tuesday, 29 August 2017 16:57
- Written by IELTS Mentor
- Hits: 22715
IELTS Academic Writing Task 1/ Graph Writing - Table:
» You should spend about 20 minutes on this task.
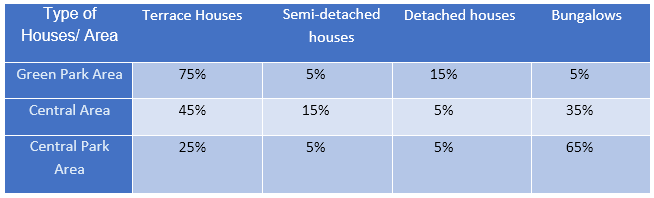
The illustration below shows the proportions of people living in different types of houses in three different areas in 2012 in Denmark.
Summarize the information by selecting and reporting the main features, and make comparisons where relevant.
You should write at least 150 words.
Sample Answer 1:
The table data compares people’s accommodation in Green Park area, Central area and Central Park area in Denmark in 2012. The types of accommodation listed are terrace houses, semi-detached houses, detached houses and bungalows. Overall, Green park inhabitants preferred terrace houses, while most of the citizens in the Central area lived in terrace-houses and bungalows while the main housing type in Central Park area was Bungalows.
According to the table data, the two-third populace in Green Park area in Denmark lived in terrace houses in 2012. 15% lived in detached houses while the remaining 10% were equally distributed in semi-terrace houses and Bungalows.
Again, Terrance houses and Bungalows were the two most common housing types in the Central area with 45% and 35% dwellers respectively. 15% people in this area were in semi-detached houses and the remaining in detached houses.
Finally, Bungalows were the primary accommodation type in Central Park are with 65% dwellers. One-quarter residents preferred terrace houses and the remaining one-tenth people lived in either a semi-detached or a detached house.


Report