IELTS graph 266 - Unemployment rates for the female in the UK
- Details
- Last Updated: Sunday, 10 September 2017 16:56
- Written by IELTS Mentor
- Hits: 26363
IELTS Academic Writing Task 1/ Graph Writing - Bar Chart/ Column Graph:
» You should spend about 20 minutes on this task.
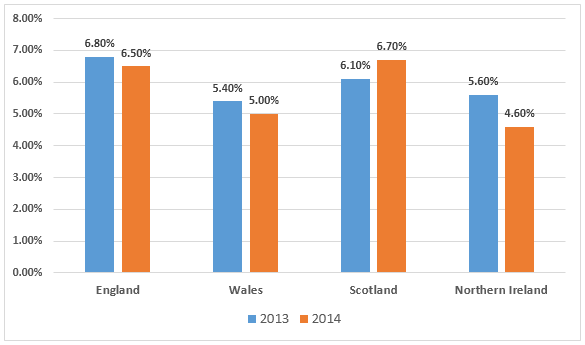
The following graph shows the percentage of unemployment rates for the female in the UK.
Summarize the information by selecting and reporting the main features, and make comparisons where relevant.
You should write at least 150 words.
Female unemployment rates in the four counties in the UK
Model Answer:
The bar graph outlines the female unemployment rates in four counties in the United Kingdom in 2013 and 2014. Generally speaking, 5 to 7 percent women in these provinces were jobless in 2013 and in a year this rate dropped slightly except in Scotland.
According to the given illustration, 6.8 percent women in England were jobless in 2013 which was higher than the female unemployment rates in Wales, Scotland and Northern Ireland. Female unemployment ratio in Wales was 5.4 % which was the lowest among the given counties. The ratio of unemployed females in Scotland and Northern Ireland stood at 6.1% and 5.6% respective.
After a year, the unemployment ratio among females in England, Wales and Northern Ireland dropped by 0.2% to 0.4% and stayed between 4.6 to 6.5 percentages but it actually increases in Scotland. The rate of unemployed females in Scotland became the highest in 2014 which was 6.7%. the lowest unemployment among female could be observed in Northern Ireland in this year.


Report