IELTS graph 268 - GDP growth per year for three countries
- Details
- Last Updated: Sunday, 01 October 2017 18:08
- Written by IELTS Mentor
- Hits: 41085
IELTS Academic Writing Task 1/ Graph Writing - Bar/ Column Graph:
» You should spend about 20 minutes on this task.
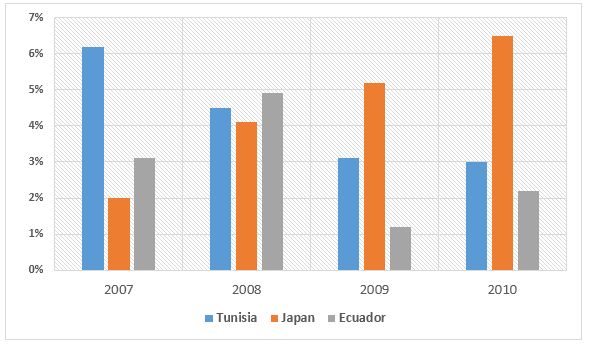
The chart below shows the GDP growth per year for three countries between 2007 and 2010.
Summarize the information by selecting and reporting the main features, and make comparisons where relevant.
You should write at least 150 words.
GDP growth (annual %)
Sample Answer:
The column graph compares the annual GDP growth of Tunisia, Japan and Ecuador from 2007 to 2010. Overall, yearly GDP (Gross domestic product) growth for Tunisia and Ecuador was higher than that of Japan in 2007 but Japan managed to accelerate it while it reduced in two other countries over the period.
To start with, GDP growth in Tunisia in 2007 was over 6% which was thrice and double than that of Japan and Ecuador respectively. Next year, all these three country’s GDP growth were similar, ranging from 4 to 5 percent. However, in 2009 Japan witnessed a steady increase in its GDP while both Ecuador and Tunisia’s GDP plummeted remarkably. The same scenario continued in the next year and Japan had a far better GDP in this year. Japan's GDP growth was almost 6.5% while it was approximately 3% and 2% in Tunisia and Ecuador.
To summarise, Japan achieved a fast-growing GDP during the given period while this rate actually declined noticeably both in Tunisia and Ecuador.


Overall, Japan’s GDP rapidly developed throughout the study period, while Tunisia GDP experienced a moderate decline. Meanwhile, Ecuador GDP experienced considerable fluctuations.
In detail, Tunisia's GDP (Gross Domestic Product) was the highest among the given three countries in 2007 - which was around 6.2%. On the other hand, Japan and Ecuador's GDP was thrice and twice as less, respectively. By next year, the Japanese and Ecuadorian's managed to marginally increase their growth by approximately 2%, while it was the opposite for Tunisia, a noticeable 2% decline for the same year.
In 2009, Japan's numbers steadily rose, while the other 2 countries had a significant drop in percentage. Finally, by 2010, Japan's figures reached their peak at almost 6.5%. By comparison, it was roughly thrice as much as it was at the beginning of the survey. Moreover, Tunisia's figures remain close to 3%, meanwhile, Ecuador's number experienced a modest rise up to more than 2%.
Overall, it is observed that the annual GDP for Tunisia and Ecuador decreased over the period. On the other hand, it rose very steadily in Japan during the given period.
In detail, the growth of GDP in Tunisia is shown in the diagram as just above 6% in 2007, which was approximately twice and thrice as much as the figure of Ecuador and Japan, respectively. However, after 3 years, the GDP growth of Tunisia was down to half as much. In sharp contrast, Japan saw its GDP rising dramatically (a three-fold increase to 6.5% by the end of the period given).
Regarding Ecuador, the country's annual GDP growth was 3% in 2007 and reached a peak of 5% the following year. In 2010, the GDP figure of the country was approximately 2.2%.
Report