Graph Writing # 132 - The results of surveys about one university
- Details
- Last Updated: Monday, 17 August 2020 17:51
- Written by IELTS Mentor
- Hits: 37701
IELTS Academic Writing Task 1/ Graph Writing - Table:
» You should spend about 20 minutes on this task.
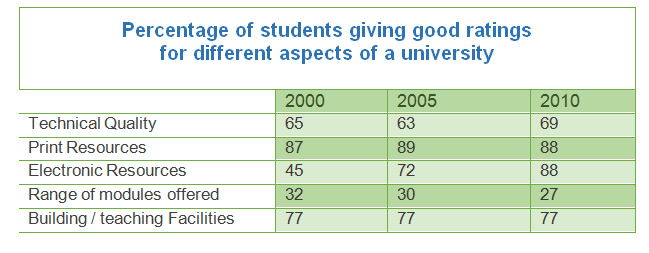
The table below shows the results of surveys in 2000, 2005 and 2010 about one university.
Summarise the information by selecting and reporting the main features, and make comparisons where relevant.
» You should write at least 150 words.
Sample Answer 1:
The chart shows the data from different polls about a particular higher establishment based on the reviews of students questioned in various years: 2000, 2005 and 2010. According to the data, given by the table, it can be clearly seen that during above mentioned years most of the students gave an excellent overview of print resources because its number remained steady.
However, young people involved in studies were less satisfied with the quality of a variety of provided modules. Its number kept declining and the lowest figure of 27 was observed in 2010. It is crucial to point out that throughout the given years the proportion of students satisfied with constructional conditions and teaching facilities did not vary. Perhaps it is an evidence of high standards of the university.
One could draw the conclusion that the vast majority of students enjoyed to its fullest extent the print resources and the organisation of teachers.
[written by Olga]
Sample Answer 2:
The provided table compares the different aspects of positive student rating about a university. The figures were based on the surveys conducted on 2000, 2005 and 2010. Overall students preferred print resources, teaching facilities, electronic resources and technical qualities of the university as the most important aspects of it.
As is observed from the given data print resources of the university got the highest percentage of positive rating (87- 89%) throughout the years. Teaching facility was the second preferred aspect of the university in the early two years while electronic resources became the most preferred aspect of the university jointly with print resources in 2010 with 88% good ratings. Technical quality obtained rating range between 63% - 69% good rating. Comparatively, electronic resources and range of modules offered received a less good rating in 2000. Interestingly in 2010, electronic resources achieved the highest popularity along with print resources. The surprising growth was from 45 to 88%. The range of modules offered is the only area that showed a downward trend of good rating over the years.
[Written by - Haisuhu]


From 2000 to 2010, the percentage of students giving good ratings for print resources changed by just 1% in every five years and remained between 87% and 89%. Interestingly, the figure for teaching facilities as a positive aspect was 77% in all three years 2000, 2005 and 2010.
Moreover, 65% of students were satisfied with technical quality in 2000 and this doubled the proportion of students with positive opinions towards the range of modules offered to students. While there was a rise to just under seven out of 10 regarding technical quality after a decade, good ratings for modules steadily declined by 3% every five years. As for electronic resources, this aspect saw the most noticeable increase, from 45% students with good ratings in the year 2000 to 72% in 2005 and 88% in 2010.
Overall, the highest percentage of "good rating" was given on printing resource and teaching facilities and over the year, the rating favoured the university except for the range of module offered.
First of all, more than 85% of the university students rated the 'print resources' with a good rating in three surveys while the 'range of modules offered' had got the least percentage of students' good rating over ten years. On the other hand, from 2000 to 2010, the technical quality and the building facilities department had a good rating of 63% to 77% from the university student. Over ten years, 'technical quality' had a slight fluctuation in terms of the proportion of students providing good ratings. For instance, in 2000, it had 65% of good rating and in 2005 the percentage of students who gave it a good rating dropped by 2%, while in 2010 it rose to 69%.
Interestingly, the building facilities had maintained its good rating at 77% over a decade. Finally, the good rating in 'electronic resources' had improved over the ten years as it got 45% students' good rating in 2000 but 88% in 2010, which, in fact, had the same percentage of good rating with the printing facilities in this University.
Report