Graph Writing # 194 - Percentage of UK adolescents following a vegetarian diet
- Details
- Last Updated: Wednesday, 26 August 2020 00:02
- Written by IELTS Mentor
- Hits: 45764
IELTS Academic Writing Task 1/ Graph Writing - Line Graph:
» You are advised to spend about 20 minutes on this task.
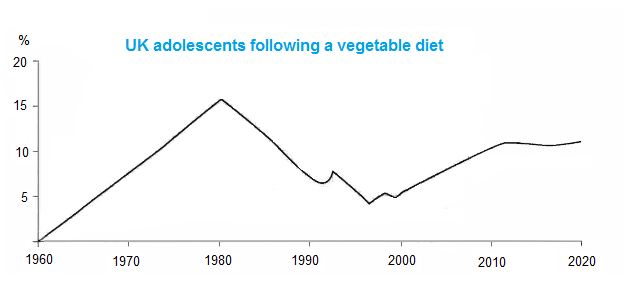
The graph shows the percentage of UK adolescents following a vegetarian diet.
Summarise the information by selecting and reporting the main features, and make comparisons where relevant.
» You should write at least 150 words.
Model Answer 1:
The line graph illustrates the ratio of young UK population who have followed a vegetarian diet from the year 1960 till the present time.
A glance at the graph reveals that the percentages of young British, who were vegetarians, kept on increasing till the '80s and then witnessed a steady decrease. After the year 2000, this ratio also kept on increasing.
Now getting back to the details, 5% adolescent in the UK had some sorts of vegetarian diet in 1970 and this ratio steadily increased till the year 1980. At that time, their ratio in the UK was the highest, over 15%. However, the percentages of vegetarian adolescence in this country gradually decreased and reached to the bottom in around 1997 with just 3%-3.5%. After the year 2000, the percentage of juvenile vegetarian again kept on going up and with some minor fluctuations, it reached around 12 percentage in the year 2019. Finally, in 2020, approximately around 13% of British young generation are vegetarians.
Sample Answer 2:
The line chart illustrates data on the ratio of vegetarian teenagers in the UK between 1960 and 2020. As is observed from the graph, the ratio of UK adolescents with a vegetarian diet increased dramatically between 1960 and 1970 and despite a significant drop after the '80s, these days a good percentage of young British follows a vegetarian diet.
From 1960 to 1980, the percentage of UK adolescents following a vegetarian diet increased modestly to nearly 15% in 1980, which was the highest proportion of young vegetarian in the UK. There was a dramatic dip, followed by a moderate rise afterwards. As is presented from the graph, after culminating the vertex in 1980, there was a decrease over the next 20 years. Since then it increased progressively. From 1990 to 2000, this ratio fluctuated and touched the lowest point in this period with just over 3% UK youth vegetarians. It is seen from the data that after some fluctuations, the percentage of teenage vegetarian dieters increased gradually until 2010 and it remained almost the same over the next decade. Finally, in 2020, almost 13% of youths in Britain follow vegetarian diets.
[Written by - Imam Safrullah]


Overall, within a 60-year period (from 1960 to the present day), this has been an increasing trend and the highest figure can be seen in the year 1980. And more specific information will be summarized in the following paragraphs.
To begin with, it was not until the 60s that a vegetarian diet was introduced to British youngsters. By 1970, 7.5 per cent of UK adolescents no longer ate meat and 10 years later, this figure exactly doubled to reach the peak- 15%.
In the 1990 decade, the proportion decreased dramatically and then hit the lowest point of approximately 4 per cent in 1997. However, this was followed by a steady rise between 2000 and 2010, as the figure increased 2- fold to the 10% mark.
From here, it has flattened off and it is worth noticing that at this moment, around 12% of all British young people are vegetarians.
Report