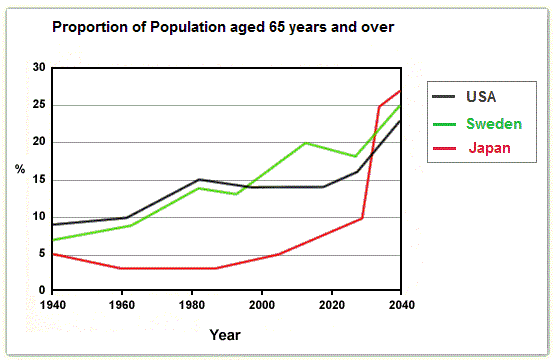
Graph Writing # 93 - Proportion of population aged 65 and over between 1940 and 2040
- Details
- Last Updated: Thursday, 16 June 2022 15:13
- Written by IELTS Mentor
- Hits: 408457
IELTS Academic Writing Task 1/ Graph Writing - Line Graph:
» You should spend about 20 minutes on this task.
The graph below shows the proportion of the population aged 65 and over between 1940 and 2040 in three different countries.
Summarise the information by selecting and reporting the main feature and make comparisons where relevant.
» Write at least 150 words.
Sample Answer 1:
The line graph depicts the percentage of senior citizens, who are older than 65 years, over a century in three countries, namely- the United States, Sweden and Japan, from 1940 and also gives projection till 2040. A glance at the graph makes it clear that Japan will have more percentage of the aged population in the future despite its fewer percentage of this population in the early 40s and one-fourth of the world population will be older people in 2040.
The illustration shows that the average old population in 1940 was between 5 to 10 percent in all the three countries and the USA had the highest percentage of aged people while it was lowest in Japan. The ageing population in the USA grew steadily and reached up to 15% in the year 2000. It is expected to be doubled and reach nearly 25% in 2040. Similarly, in Sweden, the percentage of aged people grew from about 7% in 1940 to 15% in 2000 and is heading towards 25% in 2040. In contrast, the aged population in Japan remained the lowest, which was less than 5% until 2005 and expected to grow and reach the highest point, about 30 percentage, in 2040. The graph clearly reveals that the ratio of aged population will increase in 2040 and almost one of every four citizens in these three countries would be over 65 years old in 2040.
[Written by - Shalley Daniel]
Sample Answer 2:
The given line graph compares the aged people of Sweden, the USA and Japan from 1940 and gives projection till 2040.
As is observed from the line graph, initially in 1940, the proportion of aged people who were over 64 years old was between 5 to 10 percent. This rate kept on increasing in the USA and Sweden while decreased in Japan. After 40 years in 1989, this percentage was around 15% both in Sweden and the USA while it was only 2-3% in Japan. The more the aged people in a country the better the life expectancy and medical improvement and this indicated the improvement in the USA and Sweden while downgrade trend in Japan. But after 2000, the rate of aged people in Japan kept increasing sharply and it is projected that in 2040 the number of aged people would surplus the number in Sweden and the USA though these latter two countries would also have more aged people in this coming years they have now. This also forecasts the life expectancy and medical advancement in Japan after 2030.
Sample Answer 3:
The line graph illustrates the percentage of citizens who aged 65 or above in three various nations from 1940 to 2040.
Overall, it is clearly shown that the proportion of the population who aged 65 or above in the USA and Sweden increases from 1940 to 2040 with slight drops in between whereas that in Japan decreases starting from 1940 to 1980 before a sharp rise in the number of elderly people in that country.
Initially, in 1940, there was a higher percentage of older people living in the USA (just below 10%) than Sweden (around 7%), it was then followed by Japan with only 5%. In the USA, there was an increasing trend in the proportion of elderly people from 1940 to 1980 and decreased slightly. However, it is predicted that the figure for this will eventually rise until 2040. A similar pattern can also be observed for the result obtained in Sweden, the figure for the percentage of older people increases from 1940 to 2040 with two gradual dips from 1980 to 1990 and from 2010 to 2025.
Turning to Japan, it is apparent that there was a slight decline in the proportion of older people from 1940 to 1990 before it showed an upward trend. It is believed that the figure will soar dramatically from 2030 onwards and reached its peak in 2040. Lastly, Japan will become the country with most elderly people among the three nations and USA is the least.
[ Written by - Lee Wing Qeen ]
Sample Answer 4:
The presented line graph demonstrates proportion of senior citizen in the USA, Japan, and Sweden in a century period between 1940 and 2040. In general, there has been an increase of elder population in all countries observed since 1940 and is predicted to jump up gradually until 2040.
Looking at the detail, in Sweden, the population of seniors had gradually increased since 1940. It was about 7% in 1940 and has been improved gradually year to year.
Furthermore, it is forecasted that the proportion will keep growing and will hit nearly four times higher, about 25%, in 2040. On the other hand, the USA also showed a rise in the proportion of elderly. It was only started at about 9% in 1940 and has been swelled essentially and is predicted to hit 20% in 2014.
Meanwhile, Japan showed an incredible trend of proportion. It was about 5% in 1940 and slowly had declined until around 2005 when it reached almost the same figure as in 1940, and has been dramatically increased and will rise continually to over 5 times higher, around 27%, in 2040.
[ Written by - Linda ]
Sample Answer 5:
The provided illustration reveals data about the percentages of people who were elderly in three countries. This research was conducted to looking further information in three different nations; they were Japan, Sweden and USA. All of the samples were aged 65 and over, whereas, the data provide a view in the long term which is 100 years.
Firstly, older population in Sweden and USA had a small difference in 1940 because they were both approximately 10% of the total population. These countries had a steady improvement for several years in terms of their number of elderly people. Meanwhile, they are predicted to have a similar result in 2040; their elder generation will rise around 25% in that year.
Secondly, Japan was position as the lowest ranked nation in 1940 which had less old people than the other two countries. Over the year, Japan will have the largest proportion of elder people in the future. According to the given figures, Japan will notice an increase in 2020 to 2040 in terms of their elder generation proportion. It will put Japan to have an aged population with more than 25%.
Lastly, all of the nations will have more proportion of elderly people in the coming years which indicate the enhanced life expectancy.
[ Written by - Waode Eti ]
Sample Answer 6:
The graph compares the growth of population aged 65 and over in Japan, Sweden, and America from 1940 to 2040. According to the graph, it can be clearly seen that although initially Japan’s ageing population ratio was lower than that of Sweden and USA and will remain so till 2030. But it is predicted that elder people’s percentage in Japan will increases significantly afterwards.
Based on the graph, between 1940 and 1980, Japan’s elderly population remained below 5% of total population in contrast to Sweden and USA. Senior citizens in later two countries grew gradually above 10% respective to the overall population. When Sweden and USA’s elderly population percentages slightly dropped in 1990, Japan started to show an increase in its population aged 65 and over. Further, In 2010, elderly people in Sweden and Japan rose to 20% and 7% respectively while USA’s percentage remained the same i.e. 15% in that period. Despite Sweden’s temporary drop, the population of elders will keep going up dramatically, particularly after 2020 and will peak in 2040. After 2030 Japan’s elderly population percentage will grow more than double to above 25% and that will place Japan in the highest position in terms of senior citizen ratio followed by Sweden (25%) and USA (23%).
[ Written by - Sukma Wati ]
Sample Answer 7:
The percentage of elderly people, aged 65 and over, from the year 1940 and projection till 2040 in three countries- Japan, Sweden, and United States of America is illustrated in the given diagram.
Based on the chart it can be seen that Japan had the lowest percentage of people who aged 65 and over in the year of 1940. It is surprising that Japan estimates that they will have the highest percentage of these elderly people in 2040.
By looking at the detail, in 1940, Japan had only 5% elderly people compared with the USA, where 10% of total population was over 64 years old. While the proportion of elderly progressively increased in Sweden and the USA, the number of elders in Japan decreased till the end of the 80s. After 1980, the proportion of the elderly population in Japan dramatically increased and it is estimated to extremely raise after 2020. In 2040, Japan will be the land of the highest percentage of elders.
Looking at the elderly people's percentages in two other countries- Sweden and the USA, it can be stated that, the proportion steadily increased and it is predicted that this percentage will keep on increasing. In 1940 the percentages of elderly in Sweden and the USA were about 6% and 9% respectively and it is estimated that these will reach to about one-fourth of the total population.
[ Written by - Nur Fadhilah ]

Based on the chart, it can be seen that Japan had the lowest percentage of people who were aged 65 and over in the year of 1940. It is surprising that Japan estimates that it will have the highest percentage of these elderly people in 2040.
By looking at the details, in 1940, Japan had only 5% elderly people compared with the USA, where 10% of the total population was over 64 years old. While the proportion of elderly progressively increased in Sweden and the USA, the number of elders in Japan decreased till the end of the 80s. After 1980, the proportion of the elderly population in Japan dramatically increased, and it is estimated to increase extremely raise after 2020. In 2040, Japan will be the land with the highest percentage of elders.
Looking at the elderly people's percentages in two other countries- Sweden and the USA, it can be stated that the proportion steadily increased, and it is predicted that this percentage will continue to increase. In 1940, the percentages of the elderly in Sweden and the USA were about 6% and 9% respectively, and it is estimated that these will reach to about one-fourth of the total population.
Overall, it can be seen from the graph that in all three countries, the percentage of elderly people is expected to increase by the year 2040.
In 1940, the proportion of people aged 65 or more stood at only 5% in Japan, approximately 7% in Sweden and 9% in the U.S. However, while the figure for U.S.A. and Sweden grew to about 15% in 1990, the figure for Japan dipped to only 2.5% for much of this period before rising to almost 5% again at the present time.
It is expected that the proportion of the elderly will continue to increase in the next two decades in the three countries. A most dramatic increase is predicted between 2030 and 2040 in Japan, by which time it is projected that the proportion of the elderly will be similar to all three countries.
According to what is shown, only 5% population in Japan was over 64 years old in 1940 while it was almost 9% in the USA at the same time. Sweden had around 7% elderly people this year. During the next 50 years or so, the ratio of greying people in Japan somewhat decreased while it increased in Sweden with some fluctuations. On the other hand, the USA's ageing population ratio went upward till 1980 and then remained almost constant till 2019.
The forecast shows that all these three countries will have one elderly in every five citizens in the year 2030. Finally, in 2040, Japan will have the highest percentage of elderly people, around 27%, among the three countries. This year it is estimated that Sweden and the USA will have roughly 25% and 22% aged people respectively.
As an overall trend, the graph shows an overall increase in the ratio of senior citizens in all three countries, but in 2040, Japan will have the highest ratio of old population.
In the beginning, in 1940, the percentage of older people in the USA was about 9%, the highest among the three countries. It was just 5% in Japan in the same year and around 7% in Sweden. After two decades, this ratio in Japan decreased by over 1% while it increased remarkably both in the USA and Sweden. In 2018, almost one in every five Swedish was over 64 years old while this ratio was below 15% in the USA and just around 7% in Japan.
It is projected that in 2040, exactly 2 decades from now, Japan will have the highest proportion of the elderly population which will be around 27%. At that time, one in every four Swedish citizens will be over 64 and finally, the ratio of American elderly population will be nearly 23%.
Summarise the information by selecting and reporting the main feature and make comparisons where relevant.
Answer:
The graph illustrates data about the percentage of the population aged 65 and over in the USA, Sweden, Japan over the century between 1940 and 2040.
Overall, what stands out from the graph is that there were considerable upward trends in the proportion of the population in all of the countries.
Looking at details, as regards the percentage of the aged population in Sweden that started at around 7% in 1940, began to increase with some fluctuations, and is projected to finish at about 25% in 2040. We can see that, the proportion of the population aged 65 and over in the USA was just under 10% in 1960, the highest of the given three countries, will also have around 23% aged people in 2040.
By contrast, the figure for elderly people in Japan was the lowest in 1940 but with time, it saw a gradual increase. After the year 2030, it is estimated that it will rise dramatically between 2030 and 2040, and then have the highest proportion of old people, among the three countries.
Overall, it is clear that till 1990 the proportion of aged people in the USA was higher than that of Japan and Sweden. After 2000, this ratio in Sweden went higher than that of the USA and Japan. It is projected that the Japanese elderly population will rise dramatically in coming decades.
In details, around 9% population in the USA was 65 or older in 1940. This ratio increased to 15% after four decades but after 1990, it declined by 1% and remained stable. It is estimated that around 23% citizens in the USA will be either 65 or older in 2040. The percentage of Swedish elder people was 7% in 1940, and it rose gradually and exceeded the USA's proportion of senior citizens in 1990. In 2040, one if every five Swedish would be 65 or older. Finally, 5% Japanese were 65 or above in 1940 and the ratio declined and remained stable between 1960 and 1985. It soared by 2% afterwards and then climbed steadily. It is predicted that more than one-quarter Japanese population would be older citizens in 2040 and this ratio would be higher than that of the USA and Sweden.
The provided line graph compares the proportion of elderly people from 1940 and gives projection till 2040 in three different countries, namely - the USA, Sweden and Japan.
Generally speaking, the percentage of senior citizens who are over 64 years old would increase significantly in these countries and Japan will witness a dramatic expansion in its percentage of the elderly population.
Initially, Sweden and the USA had approximately 7% and 9% of the elderly population respectively in 1940. Starting from 2000, both countries witnessed an upward trend in their ratio of seniors and it reached to about 15% in this year with some minor fluctuations. Japan, on the other hand, had only 5% elderly population in 1940 and this percentage remained almost the same in 2000 with some fluctuations in the previous years. The percentages of elderly population in these three countries, in recent years, are 20% (Sweden), 14% (the USA) and 7% (Japan). Afterwards, from 2000 all three countries expect to witness a rapid increase in their elderly population and make a new peak. In the following three decades, there will be a significant rise in ageing in each of the three countries. Japan will reach the highest level, which will be more than 25% and the USA and Sweden will be slightly below this, at 23% and 25% respectively.
The provided line graph illustrates the percentages of elderly people aged 65 and over from 1940 and gives projection till the year 2040 in three different countries, namely - the USA, Sweden and Japan.
As is obvious in the given illustration, the percentages of the senior citizens, who are over 64 years old, would grow significantly in these countries and Japanese will witness a dramatic increase in their percentages of the elderly population.
To begin with, Sweden and the USA had approximately 7% and 9% elderly population, respectively in 1940. Till 2000 both countries witnessed an upward trend of their senior citizen's percentages and it reached to about 15% in this year with some minor fluctuations. Japan, on the other hand, had only 5% elderly population in 1940 and this percentage remained almost the same in 2000 with some fluctuations in the previous years. The percentages of aged population in these three countries in recent years are 20% (Sweden), 14% (the USA) and 7% (Japan).
Interestingly, these percentages are projected to grow very swiftly in the future, and in 2040, Japan will have the biggest percentage of elderly, more than 27%. In this year, a person out of four in Sweden will be a senior citizen and in the USA's elderly population percentage will increase to approximately 23%.
Overall, the proportion of older people will increase remarkably after the year 2020 and Japan will have the highest percentage of that older population.
As is presented as a census of a perusal in provided illustration, Japan, Sweden and the USA had around 5%, 7% and 9% older population respectively in 1940. The proportion of older people who are over 64 years old decreased slightly until 1960 in Japan and met 3% as nadir and remained stable at that percentage until 1990. After 2030, this ratio is predicted to increase dramatically and in 2040, more than 26% Japanese will be older than 64 years. In 2040 Japan will have the highest percentage of older people among the three given countries. In the USA and Sweden, percentages of older generation ascended simultaneously until 2000. After that ratio of older people in the USA is fixed almost until 2020 but Sweden's portion rose after 2000 and will surplus the USA's older generation eventually. In 2040 the USA and Sweden will have 23 and 25% older people as peak respectively.
Report