Graph Writing # 103 - Quantities of goods transported in the UK between 1974 and 2002
- Details
- Last Updated: Thursday, 04 August 2022 15:54
- Written by IELTS Mentor
- Hits: 353216
IELTS Academic Writing Task 1/ Graph Writing - Line Graph:
» You should spend about 20 minutes on this task.
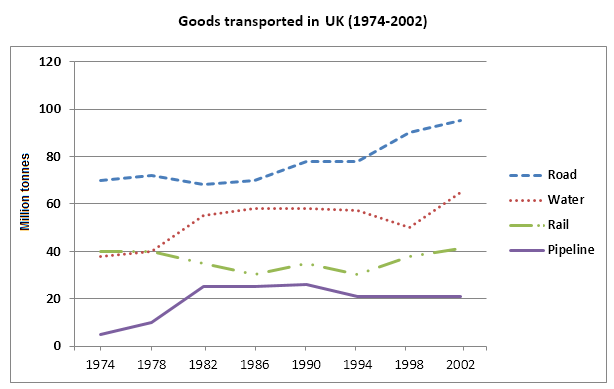
The graph below shows the quantities of goods transported in the UK between 1974 and 2002 by four different modes of transport.
Summarise the information by selecting and reporting the main features, and make comparisons where relevant.
» Write at least 150 words.
Sample Answer 1:
The line graph compares the supply of goods transported in the United Kingdom from 1974 to 2002 via road, water, rail and pipeline. Overall, road transportation and water transportation carried more quantity of goods in the UK than the amount carried by pipelines and rails.
According to the given data, initially in 1974, more than 70 million tonnes of products were transported to the UK on the road while around 40 million tonnes was transported via water and rail transportations. Least quantity of supplies (around 5 million tonnes) was transported in pipelines in this same year. Over the year, the goods transported via road increased with some fluctuations and reached to about 100 million tons in 2002. The water transports were used more for transporting goods to the UK and except in 1998, the amount of goods transported in waterway kept on increasing and finally reached over 60 million tons in 2002. The use of rail transportation system for carrying goods to the UK got reduced as less quantity of goods were transported in rails later years but finally, the quantity reached to 40 million tons in 2002. Finally, goods carried by pipelines increased over the year reached over 20 million tons in 2002.
In summary,
Sample Answer 2:
The graph illustrates the differences in transport from 1974 to 2002 in UK transport. It can be noticed that the graph for pipeline remained steady from 1994 to 2002. However, other means of transportation on roads, water and railways went up slowly in the same year.
Goods transported using pipeline in the UK from 1974 and 2002 stayed constant at 20 million tonnes from 1994 up to 2002, which started at about one million tonnes in 1994. Unlike, Road and Water goods transported in those rose to 40 million tonnes. At the beginning of 1974, Pipeline increased in 1982 to almost 20 million tonnes and still maintained the same level from 1982 to 1990 and between 1990 to 1994 decreased slowly.
Three goods transport in the UK (1974-2002) were Road, Water and Rail showed a rise slowly in 2002. Goods transported in Road got higher than Water and Rail. Although, the waterway goods transportation stayed constant at approximately 60 million tonnes in 1982. Roadway transported goods reduced slowly to about 70 million tonnes. The pipeline had different statistics which increased slowly but most still levelled out at null to twenty million tonnes than others fluctuated from 1975 until 2002.
[ Written by - Dessy Itaar ]
Sample Answer 3:
The line graph indicates the amounts of goods transported using four distinct types of transport in the UK from 1974 to 2002. Overall, it is clearly shown that the amounts of goods transported in the UK by all four different types of transport increased over the given period. It is noticeable that there was a significant rise in the quantities of goods transported by road in the UK from 1974 to 2002.
First and foremost, the most significant change in goods transported in this country on road generally increased from 1974 to 2002. It was about 70 million tonnes in 1974 rose to its highest point at just under100 million tonnes in 2002. This similar increasing trend can be seen on goods transported by water and pipeline, they started just below 40 and about 5 million tonnes respectively and rose to just above 60 and above 20 million tonnes in the last year. Among the three types of transport, goods that were transported on road were the most popular modes of transport.
An opposite trend can be observed for the goods transported using rail. In 1974, it was exactly 40 million tonnes and declined to about 30 million tonnes in 1984. It then showed a fluctuation pattern from 1984 to 1995. It rose considerably until the year 2002 and reached its peak at just over 40 million tonnes.
[ Written by - Lee Wing Qeen ]
Sample Answer 4:
The supplied line graph outlines the goods transportation in the UK from 1974 to 2002 through various modes of transportation namely road, water, rail and pipeline. In general, the quantities of materials transported increased in all types of transportation types over the years.
Looking at the details, goods brought through road transport swelled significantly from about 70 million tons in 1974 to about 95 million tons in 2002, approximately 25 million tons higher than in 1974. The same trend was true for both water and pipeline goods carrying. Water shipping distributed about 39 million tons of materials in 1974 and about 62 million tons in 2002. Pipeline showed the same trend despite the figure of goods carried was roughly slower than water transport, pipeline media only moved about 2 million tons in 1974 and about 21 million tons in 2002.
In contrast, the number of commodities brought through rail mode fluctuated gradually. It was about 40 million tons in 1974 and went down modestly by the year of 1978 and this quantity fluctuated until it levelled up to about 41 million tons in 2002. It accounted for a small change indeed, only about 1 million tons over the years.
[Writtenn by - Linda ]
Sample Answer 5:
The provided line graph reveals information about the figures for commodities transported in the UK from 1974 until 2002 by using four kinds of transportation. Those transportations were roads, water, rail and pipelines. In general, most of the goods transported via those transportation systems unveiled positive trends which increased gradually for 28 years.
It can be seen that the highest amount of commodities transported was shown by land transportation which was around 70 million tonnes in 1974 to approximately 100 million tonnes in 2002. As a result, it can be stated as a huge improvement among other mentioned transportation. In the second place, there was water transportation which gained about 20 million tonnes of goods in the observed years.
Furthermore, the fluctuation trend came from rail transportation. In 1974, the usage of the train for transporting goods was quite similar to water transportation about 40 million tones; however, during the following years, it gave a tiny increase. Subsequently, pipeline carried the lowest amount of supplies in 1974 which was around 10 million tons. After that, this mode of transport brought promising improvement until in 1994 which remained steadily above 20 million tones.
[ Written by - Waode Eti ]


Overall, transferring by road was the most popular and went on growing up, while the pipeline was the rarest way for transporting and slightly expanded during all period. Value of the usage of water and rail transport started at the same value, nevertheless dispersed to up and down respectively.
First, as it is presented in the graph, road and pipeline transportation for goods had a similar trend: increasing with some fluctuations. During the 1970s and 1980s, road transport for importing goods was more popular and showed a temporary dwindle until 1994, then again grew up to approximately 100 million tones per year, while pipeline choice as transport marginally rose up until 1994. After this, the index constantly was approximately 20 million tonnes per year.
On the contrary, it is remarkable that the index of road and water as transport way started at 40 million tonnes per year. Road transportation of products increased up to 60 points to 1982 and after tiny fluctuations, hit the highest point in just over 60 points. Water transportation of goods, on the other hand, fell gradually to almost 25 points until about 1985 and fluctuated near that value, following which it returned to 40 million tonnes per year.
The line graph provides information about the transportation of goods in the United Kingdom via road, water, railway and pipeline transportation systems, from 1974 to 2002.
It is obvious that the road and water transportation reached the apex from 1974 to 2002, while the rail and pipeline have transported less amount of goods, compared to the other two modes.
It could be plainly viewed that the road transportation, initially in 1974 transported 70 million tonnes of goods and had an upward tendency of about 90 million tonnes at 2002, while the pipeline was initially in the nadir point by 10 million and gradually rose by 20 million in 2002. It is interesting to note that the goods from the water and railway transportations in 1978, practically were the same with 40 million tonnes, then gradually increased up to 2002 (70 million) before a major drop in 1998 (30 million). It is clear from the data that the pipeline has the lowest point in the graph where it initially in 1987 (10 million ) and over the years, dramatically increased over 20 million tonnes in 2002.
Overall, it can be seen that the highest volume of goods was transported to the UK through roadways, while the pipeline managed to increase, but it was the lowest used among others to import products in the UK.
The supply of goods transported through roadways started at around 70 million tonnes in 1974 and reached a peak of almost 100 million tonnes. Likewise, the pipeline’s supply of goods was initially 5 million tonnes and soared to four times as above 20 million tonnes in the final year.
In terms of water and railways, both began at 40 million tonnes in 1974. However, goods transported in water showed a steady increase to 60 million tonnes before falling in 1998 and again hit a high of almost 70 million tonnes over the period. On the other hand, transportation through railways fluctuated over the years and hit a low of nearly half of it and reached where it was kicked off.
Overall, it is evident to concur that roads have been primarily used as a means of transport over the said period continuing to be at the apogee. The pipeline, on the other hand, has remained at the nadir. However, all the modes of transportations have shown an increase somewhere near 1996.
Roads dominated the transportation in 1974, that transported approximately 70 million tonnes of goods, albeit it has seen some ups and downs but has remained most used means of transport for 28 years reaching almost 100 million tonnes in 2002 in the UK. Waterways transported somewhat below 40 million tones in 1974 which was below the rail road that was 40 million tones. But in the year 1978, the waterways crossed the rail transportation and increase to little below 60 million tonnes during 1982 to 1998 from where it increased and crossed the threshold of 60 million tonnes somewhere between 1998 to 2002. However, goods transported via rails declined to 30 million tones in 1995, from where it has shown an increasing trend from 1998 to 2002.
Finally, the pipeline started at somewhat near 2 million tonnes, showed an increase and reached the threshold of little above 20 million tonnes in the year 1994 and has remained constant since then.
Overall, the UK’s import through road, water and pipeline experienced gradual growth whereas, merchandise transportation via rail varied throughout the period.
According to the graph, imported product transportation via road was the most preferred throughout the period. The quantity rose from around 70 million tonnes in 1974 to just below 100 million in 2002. Similarly, goods imported via water transport also enjoyed growth despite a small slump between 1994 and 1995 before reaching the mark just below 65 million tonnes in the year 2002. Although the pipeline was the least preferred mode of goods transportation, it experienced continuous growth and reached just above 20 million tonnes mark in 2002. In contrast, rail network suffered a decline and fluctuations until the year 1994 before overthrowing its initial figure of 40 million tonnes mark to around 42 million in the year 2002.
In general, road transportation was the most used mode of carrying goods in the UK while the pipeline's use was the least during the period.
In details, goods transportation into the UK via road was the most common during the whole period. In 1974, roughly 70 million tons of goods were carried in the UK and it reached almost 100 tons in 2002. In the later years, the roads transports were increasingly used. The quantity of product imported via water in 1974 was 40 million and rose to 62 million in 2002. On the other hand, railway transportation accounted for 40 million tons of product transportation but the amount decrease from 1978 to 1998 before levelling out. However, pipeline transportation was the least used mode of transport for conveying goods in the UK. Around 2 tons of products were brought into the UK via this transport in 1974 and this quantity increased by ten times in 2002.
(By - Leopard)
Overall, the graph shows how the transportation by roads, water and pipelines soared significantly whilst the amount of moving goods by rails had fluctuating trend over the given period.
In 1974, while transporting by water and rail were about 40 MT, most of the goods were moved by roads which were approximately 70 million tonnes. The pipeline transported by far the least weight of commodities (about 5 MT). However, during these 28 years, the goods which were moved by road and water swelled significantly with some fluctuations to approximately 100 MT and 65 MT respectively.
Furthermore, the use of the pipeline to transport goods had an upward trend. So after 28 years, it moved 20 million tonnes. Transporting by rails, on the other hand, had a downward trend before 1994, when it reversed, and eventually reached as much as the starting point.
Overall, road transportation, for carrying goods in the UK, was used more than any other means while the pipeline was used the least throughout the period.
In 1974, about 70 million tonnes of goods were transported by road and this volume increased to almost 100 million over the next 28 years. Product transportation by water stood at almost 40 million in 1974 and rose by approximately 22 million in 2002. Between 1982 and 1994, the total goods transported using waterway remained stable at 60 million. On the other hand, although rail transportation was used to move 40 million tonnes of products in 1974, the same as water, this figure dropped to below 40 million between 1978 to 1998.
In 2002 this means of transport was used at the same level as it was in 1974. Finally, the use of pipeline was minimal in 1974, about 10 million and this figure went up to more than double in 2002. Interestingly, the use of the road, water and pipeline transportations grew but the use of rails for transporting commodities remained almost the same.
Overall, roads had always been the most preferred mode of transportation for importing goods into the UK while the pipeline was least used transportation type.
In 1974, less than 10 million tonnes of goods were carried in the UK via pipelines and that was far less than 75 million tonnes carried via roadways. It increased up to about 20 million tonnes in 2002 but still remained at the bottom. Again, the use of waterways for transportation increased between 1978 and 1982. It remained steady until 1996 and increased up to 60 million tonnes in 2002. The railway used for carrying goods decreased over the years with some fluctuations but by 2002 it came to 40 million tonnes, which was same as in 1974. Finally, the use of roadways saw a hike with some fluctuations from 75 million tonnes in 1974 to 100 million tonnes in 2002 making it the most popular mode of goods transportation.
Report