Graph Writing # 139 - Amount and type of fast food consumed by Australian teenagers
- Details
- Last Updated: Monday, 17 August 2020 17:56
- Written by IELTS Mentor
- Hits: 228965
IELTS Academic Writing Task 1/ Graph Writing - Line Graph:
» You should spend about 20 minutes on this task.
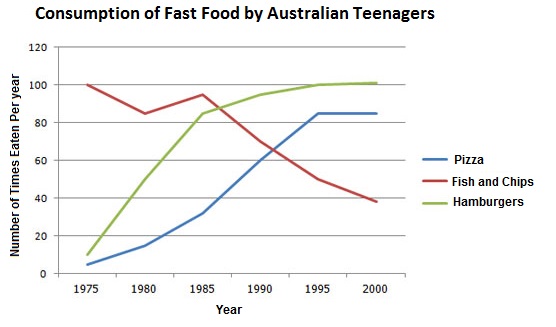
The line graph below shows changes in the amount and type of fast food consumed by Australian teenagers from 1975 to 2000.
Summarise the information by selecting and reporting the main features and make comparisons where relevant.
» Write at least 150 words.
Sample Answer 1:
The given line graph depicts the Australian teenagers’ habit of fast food consumption between 1975 and 2000 years. It can be seen from the graph that the popularity of hamburgers rose dramatically among the Australian teenagers whereas the fish and chips gradually decreased.
According to the graph, in 1975, the fish and chips were very famous among the teenagers of Australia. Moreover, at that time, it was eaten almost 100 times per year. After that in 1980, the popularity of fish and chips decreased consistently; again it increased slightly in 1985. Then from 1985 to 2000 the demand for this fast food fell significantly: just under the 40 times eaten per year.
On the other hand, it appears from the graph that the popularity of pizzas and hamburgers rose substantially. Nevertheless, the demand for pizza was constant over a period of 1995 to 2000 and it was nearly eaten 85 times in a year. On the other side, the consumption rate of hamburgers exponentially increased from 1985 to 2000 and the number of eaten times per year was just above 100 times.
[ Written by - Main Uddin ]
Sample Answer 2:
The given line graph represents the consumption of fast food by Australian teenagers between 1975 to 2000; 25 years long gap. Here Pizza and hamburgers were continuously consumed more than the fish and chips which are consumed in high quantity in 1975, but after that, the rate fell down slowly.
Firstly in 1975 Australian teenagers consumed fish and chips in high percentage which is about 100 times eaten, while on the other hand, the ratio of hamburgers and pizza in 1975 is just 5 times which depicts that their eating rate is less than the other one. After that from 1980 to 1985, Fish & chips eating ratio gets down as compared to pizza and hamburgers which show a high ratio in Australian teenagers.
After 1985 to onwards, Proportion of fish and chips gets down and down in Australian teenagers while on the other hand Pizza and hamburgers become prominent and their eating percentage grow up on the top level. And finally one can say that hamburgers were taken high rank in eating as compared to others among the Australian teenagers. And the hamburger graph line is just above the remaining lines.
So from this, we conclude that Australian teenagers were interested in fish and chips than others. While after few years they get interested in hamburgers mostly and also interested in pizza. This can clearly justify from the graph lines.


Answer: The line graph depicts figures for consumption of pizza, fish and chips, and hamburgers from 1975 to 2000, by Australian teenagers. As is observed, the Australian teens preferred to consume fish and chips in 1975 which gradually became the least consumed item in 2000 while the consumption of pizza and hamburger soared.
According to data, in 1975, fish and chips consumption rates were the highest among teenagers in Australia. Each of them consumed this fast food item 100 times per year. In 1980, the popularity of fish and chips was 85 times of consumption per year. Also in 1985, it increases to 94 times but the rate was low at the end of 2000 respectively by 40 eaten times per year.
On the other hand, the consumption of pizza in 1975 was the least - only 10 times consumptions by a teen in a year. The consumption rate of pizza skyrocketed over the years and reached 100 in 1995. Afterwards, it remained the most popular fast food items among the given items.
Finally, the consumption rate of hamburger followed a similar pattern as of pizzas. Only around 5 times per teen consumptions of hamburger in 1975 reached to over 80 after 1990.
Report