Graph Writing # 153 - Average monthly rainfall and temperature of East Africa
- Details
- Last Updated: Tuesday, 25 August 2020 23:56
- Written by IELTS Mentor
- Hits: 150351
IELTS Academic Writing Task 1/ Graph Writing - Bar/Column Graph:
» You should spend about 20 minutes on this task.
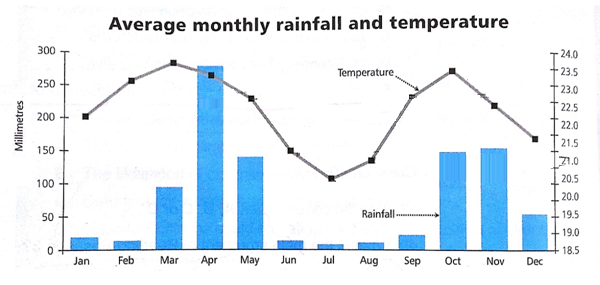
The graph and bar chart below show the average monthly rainfall and temperature for one region of East Africa.
Summarise the information by selecting and reporting the main features, and make comparisons where relevant.
» Write at least 150 words.
Sample Answer:
The line graph and bar chart illustrate the mean rainfall and temperature in a month for a period of a year in part of East Africa. Overall, it is clear that there is a direct link between the average temperature and rainfall and both of them show fluctuation throughout the 12-month period.
First of all, the most noticeable feature of the line graph is that the temperature reaches the first peak in March and second in October (just above 23.5°C and well over 23.0°C respectively). The next striking feature of this graph is the temperature has the lowest point in July which is approximately 20.5°C. To compare, the temperature over the time frame, it is apparent that temperature in December is lower than that in January (around 21.5°C and 22.0°C respectively).
Turning to the bar graph, we can see the peak of mean rainfall of the year is in April which is the overall highest peak and in November with the figure around 275mm and 150mm correspondingly. The lowest rainfall of the year falls in July with just under 25mm. Not forgetting to mention that, there is more rainfall in the first six months of the year than months after July.
[ Written by - Lee Wing Qeen ]

Report