Graph Writing # 161 - Annual expenditures on cell phone and residential phone in the US
- Details
- Last Updated: Tuesday, 25 August 2020 23:57
- Written by IELTS Mentor
- Hits: 106438
IELTS Academic Writing Task 1/ Graph Writing - Line Graph:
» You should spend about 20 minutes on this task.
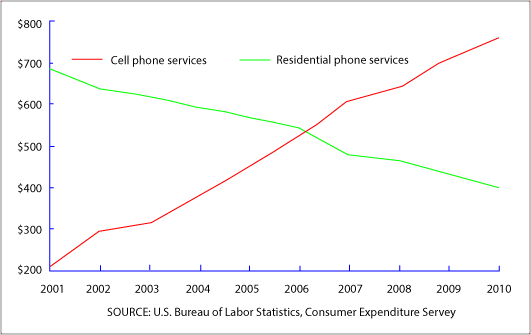
The graph below shows US consumers' average annual expenditures on the cell phone and residential phone services between 2001 and 2010.
Summarise the information by selecting and reporting the main features and make comparisons where relevant.
» Write at least 150 words.
Sample Answer 1:
The given line graph depicts the data of average yearly spending of US consumers on the cell phone and residential phone services over a decade from 2001.
A cursory glance at the graph is enough to show that the customer spending on residential phone decreased and on the mobile phone had increased. In the beginning year, that was in 2001, the phone users spend massive $690 for residential phone services. Whereas, on mobile phone services they spent almost six-fold less than the land phone, that was 200$. Again, the very next year in 2002, the mobile customer spending pattern slightly went up to $300. Surprisingly, the residential phone users’ expenditure dropped to $650 in the same year. In the following years, the cell phone users spending skyrocketed and residential phone users spending dropped down and reached the same rate of $550 in 2006. Then, the land phone users spending pattern sank to $400 in 2010. However, the cell phone users spending hiked to almost two-fold than residential phone users, that was around $800 in the same period.
Overall, the residential phone user declined tremendously and cell phone users increased in the USA during the period of from 2001 to 2010.
Sample Answer 2:
The line chart illustrates the average spending of the US people for mobile phone and fixed line services between 2001 and 2010. It can be seen that the annual spending for cellular services had increased sharply over the abovementioned period, while the residential one had a declining trend.
In 2001, the amount of money that was spent by an American resident for residential phone services was around $ 690. This amount was far higher than the figure for the cellular services, which stood at approximately $210. It is noticed that in 2006 the spending on fixed line services decreased to $550, while the average spending on cellular phone services rose to the same figure as the residential services.
From 2006 to 2010, the average annual spending of the American for cell phone services continued to increase to more than $ 750 per year. As for the residential services, the number of spending continued to decrease to just above $400 in 2010.
In summary, it is clear that over the ten-year period, the average expenditure of American people on phone services had changed. The spending amount on mobile services had risen sharply by almost quadruple, while the figure for residential service had dropped by almost half.
[Written by - Darwin Lesmana ]

Report