Graph Writing # 186 - Student involvement in three sports in a school
- Details
- Last Updated: Wednesday, 26 August 2020 00:01
- Written by IELTS Mentor
- Hits: 29146
IELTS Academic Writing Task 1/ Graph Writing - Bar Graph:
» You are advised to spend about 20 minutes on this task.
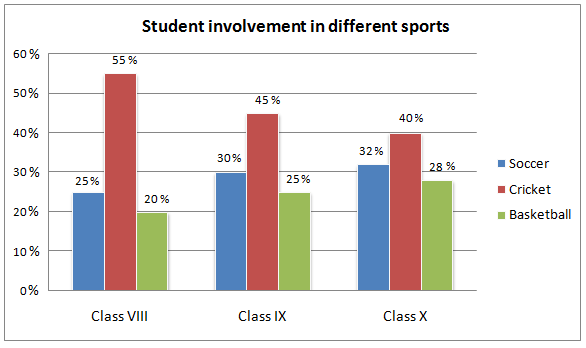
The graph below shows the student involvement in three sports in a school based on which grades they are studying in.
Summarise the information by selecting and reporting the main features and make comparisons where relevant.
» You should write at least 150 words.
Sample Answer 1:
The column graph shows the percentages of students from eight to ten grades in a school who are involved in three sports, namely - soccer, cricket and basketball. At a glance, it is clear that more students participated in cricket than other two sports.
Now turning back to the details, more than half of the eight graders in this school play cricket while a quarter of this class students participates in football. Every participant out of five from class eight play basketball. 45% students from class nine are actively involved in playing cricket and this is exactly 15% higher than that of soccer players from this class and precisely 20% higher than the percentage of basketball players. Finally, two out of five tenth graders participated in cricket, which is in fact, played by the highest proportion of students from class eight to ten, and 28% pupils from class ten play basketball, which is the least preferred outdoor games among those pupils. Football, as a sport, is taken up by 32% tenth graders, which is evidently more preferred than basketball but less than cricket by these students.
[Written by - Gabriel]
Sample Answer 2:
The graph presents the engagement of grades 8, 9 and 10 students in three different outdoor games namely: cricket, soccer and basketball. Obviously, it is clear that most students are more engrossed in cricket that the other two sports and football, as a sport, was their second choice.
The trend presented in the diagram shows that more than half of the grade nice students prefer cricket while the other graders have marginally lesser interests in joining this sport with 45% and 40% cricket players respectively. However, it is quite obvious that the participants from these grades mainly play cricket. On the other hand, football comes at the second choice as an outdoor sport among these pupils. At least a quarter of grade eight students joined in to play football while roughly one-third of ninth graders are involved in playing this sports. Furthermore, more than 30 percent of students in grade ten participate in football. Lastly, basketball is one of the least preferred sport by the students of these classes having less than a third of the students interested in playing it.
Overall, it is safe to say that most students prefer to play the cricket regardless of what grade they are in.
[Written by - Karen]


As the diagram suggests, pupils prefer cricket to soccer and basketball; furthermore, the latter is the least popular. To begin with, more than half of all 8th graders choose cricket while at the same time, those figures for 9th and 10th graders were 45% and 40%, respectively. On the other hand, the proportion of 8th-grade soccer players is one-fourth, meaning thirty per cent less than that of students at the same age joining cricket. Additionally, slightly more than three out of every ten students in the highest grade take part in soccer activities.
Only exactly 20% of all eighth-graders choose basketball, while the figures stood at 25% for grade 9 and 28% for grade 10 pupils. It is also worth noticing that basketball and soccer are mostly favoured by tenth graders while cricket attracted the highest percentage of participation from those in grade 8.
Report