IELTS graph 277 - Telephone subscribers in Vietnam - 2010
- Details
- Last Updated: Monday, 13 November 2017 20:02
- Written by IELTS Mentor
- Hits: 14308
IELTS Academic Writing Task 1/ Graph Writing - Bar Chart/ Column Graph:
You should spend about 20 minutes on this task.
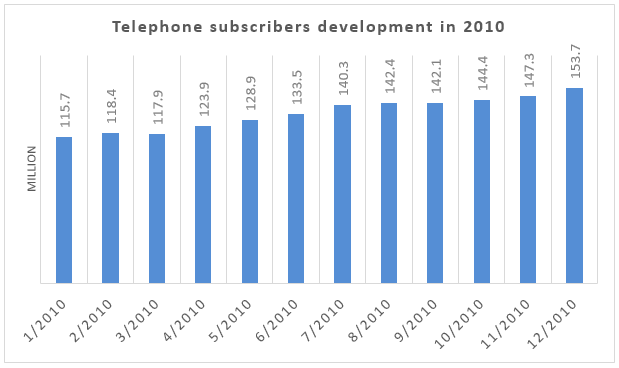
The chart below shows how the telephone subscribers in Vietnam developed throughout the year 2010.
Summarize the information by selecting and reporting the main features, and make comparisons where relevant.
You should write at least 150 words.
Sample Answer:
The bar chart illustrates how the Vietnamese telephone users grew during the year 2010. Overall, the telephone subscribers in Vietnam gradually increased throughout the in 2010.
As is presented in the diagram, total Vietnamese telephone customers in January 2010 was over 115 million and this number increased by 3 million in February. With a slight drop, the subscription stood at around 118 million in March and then went as high as over 142 million in August 2010. Afterwards, total users dropped a bit before jumping over 144 million in October in this year. With a steady rise, total phone subscribers in Vietnam reached to over 153 million which was almost 40 million greater than the number of subscribers at the beginning of the year. It is worth noticing that the number of telephone subscribers in Vietnam progressively developed except in March and September when the telephone users actually declined than the preceding month and the largest number of new telephone users subscribed between June and July, roughly 7 million.


Overall, the growth of telephone subscription in Vietnam was non-linear with few fluctuations and by the end of the year, a significant increase was recorded.
In details, according to the graph, in January, 115.7 million people subscribed for the telephone connection. While it recorded an approximately 3 million rise in February, the demand dropped by 0.5 million the next month. However, other than March and September, where the telephone connection demand witnessed a marginal decline than the preceding month, the subscription maintained its increase and by July, around 25 million more customers opted for telephone than that of January.
Lastly, it is worth noticing that, September onwards the subscription developed progressively and reached the highest number by the end of the year when it recorded more than 150 million subscriptions, which were roughly 40 million more than what it was at the beginning of the year.
Overall, telephone users in Vietnam increased slowly but steadily in 2010, except for March and September. More specific information will be summarized below.
The diagram suggests that almost 116 million people in Vietnam used telephone service at the beginning of the year. And in December, the number increased by more than 30% and at this point, more than 163 million people had phone connection. As is mentioned, the subscribers' number declined slightly in March September. 117.9 million subscribers in March 2010 were exactly half a million short than the previous month. The drop in September was less significant, just 0.3 million, to be exact.
And finally, the most noticeable surge in the number of subscribers was seen between June-July and November-December. The figures of June, July, November and December were 133.5, 140.3, 147.3 and 153.7 million, respectively.
Report