IELTS graph 311 - UK investments in clean energy from 2008 to 2015
- Details
- Last Updated: Tuesday, 06 February 2018 14:43
- Written by IELTS Mentor
- Hits: 40910
IELTS Academic Writing Task 1/ Graph Writing - Bar/ Column Graph:
You should spend about 20 minutes on this task.
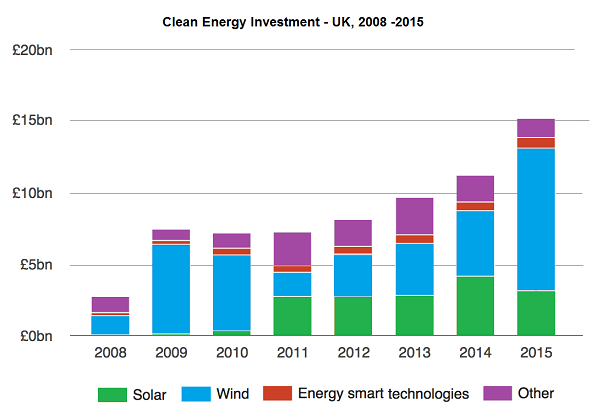
The graph below shows the amount of UK investments in clean energy from 2008 to 2015.
Summarise the information by selecting and reporting the main features, and make comparisons where relevant.
You should write at least 150 words.
Sample Answer:
The bar graph presents data on the United Kingdom’s annual investment on clean energy between 2008 and 2015. As is obvious, the UK budget on eco-friendly energy increased over the period and wind power got a considerable attention in terms of the grant it received.
As the data suggests, the UK authorities financed nearly two and half billion pound in 2008 to generate eco-friendly power and half of it went on the wind power sector. Next year budget for wind power almost trebled while a small portion was spent on energy smart technologies and solar power. More than 7 billion was invested in 2009 in the UK to generate clean energy which went as high as 15 billion in 2015. The investment in next two years, 2010 and 2011, remained alike but more than one-third was disbursed for the solar power. From 2012 to 2015, the UK spent roughly 3-5 billion yearly to produce solar energy. The UK government mainly invested on wind and solar power in later years and energy smart technologies attracted a steady portion of UK clean energy investment throughout the period.


Commencing since 2008, approximately two and a half billion had been allocated and a half of it went to wind power. It is obvious that the UK government favoured more investment into wind energy by granting more than two billion, at least, funding without a miss every year. In the next year, in 2009, wind energy investment tripled whereas around 6.5 billion was disbursed in it than the previous year. In 2010, the country started to grant half a billion pounds in solar power and the figure soared enormously standing approximately at 3 billions remaining alike for the next three years consecutively.
Meanwhile, the investment allocation for wind energy dipped in 2011 but gradually rise over the following years where almost ten billion were accounted for its peak during 2015. The rest of the sectors received less attention from the funding where it is evident that smart energy technologies got the least amount.
Overall, the graph clearly wraps up that the UK government had invested in clean energy - mainly in wind and solar power throughout the period.
Report