IELTS Academic Writing Task 1/ Graph Writing – Bar Chart/ Column Graph:
» You should spend about 20 minutes on this task.
The following graph shows the percentage of unemployment rates for females in the UK.
Summarise the information by selecting and reporting the main features, and make comparisons where relevant.
You should write at least 150 words.
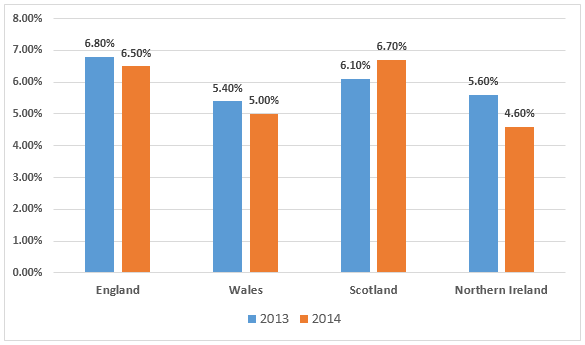
Female unemployment rates in the four counties in the UK
Model Answer 1:
The column graph compares female unemployment rates in four parts of the United Kingdom in 2013 and 2014, with figures given as percentages.
Overall, the proportion of unemployed women fell slightly in most areas in 2014, while Scotland was the only exception, showing a clear rise. Moreover, England recorded the highest unemployment rate in 2013, whereas Wales managed to keep it the lowest.
In 2013, England had the highest unemployment rate among females, at nearly 7%. Scotland followed at just over 6%, while Northern Ireland and Wales stood at lower rates, at around 5.6% and 5.4% respectively. In the following year, female unemployment declined marginally in England to about 6.5%, and it also fell in Wales and Northern Ireland to 5% and 4.6%.
By contrast, Scotland’s female joblessness moved in the opposite direction. Its rate rose noticeably from about 6.1% in 2013 to 6.7% in 2014, meaning it almost matched England by the end of the period. Despite these changes, the overall range remained fairly narrow, with all figures staying between just over 5% and under 7%.
Sample Answer 2:
The bar graph outlines female unemployment rates in four counties in the United Kingdom in 2013 and 2014.
Generally speaking, 5 to 7 percent women in these areas were jobless in 2013, and in a year, this rate dropped slightly except in Scotland.
According to the given illustration, almost 7% women in England were jobless in 2013, which was higher than the female unemployment rates in Wales, Scotland and Northern Ireland. This year, the ratio of unemployed women in Wales was over 5%, which was the lowest among the given counties. This rate in Scotland and Northern Ireland stood at just over 6% and 5.6%, respectively.
After a year, the unemployment rates among females in England, Wales and Northern Ireland dropped by 0.2% to 0.4% and stayed between 4.6 to 6.5 percentages, but it actually increased in Scotland. This rate in Scotland became the highest in 2014, which was almost 7%. The lowest female unemployment rate could be observed in Northern Ireland this year (4.6%).
The line reads – “6.8 percent women in England were jobless in 2013” this is the unemployment rate, not unemployed employees. completely different things. “5 to 7 percent women in these provinces were jobless” same mistake. So understanding of the subject is of utmost importance.
Someone who has been employed for more than 5 years, and is currently not employed, is also considered ‘unemployed’. Unemployed does not mean someone who has never been engaged in a job; rather, someone who does not work now and does not earn money from a job, trade or business.