IELTS Academic writing task 1 – Pie Chart
A pie chart is a circular diagram (much like a “pie”, and hence the name) divided into sectors or “slices” to illustrate numerical proportions or percentages of a whole. In your IELTS Academic Writing Task 1, you may receive a pie chart representing data such as population distribution, expenditure patterns, or resource allocation. Each sector of the pie chart corresponds to a category, and the size of the sector reflects its proportion relative to the whole. Your task is to write a concise report summarising the key features, trends, and comparisons evident from the chart rather than expressing personal opinions. Pie charts are often used to highlight relative sizes, percentages, and differences among categories in a visually clear way.

In your IELTS test, it is recommended to complete your pie chart writing within 20 minutes. Your answer will be assessed based on your ability to:
» Objectively describe the main features presented in the chart.
» Make comparisons and note significant differences between categories.
» Present information clearly and accurately without including personal opinion.
Links to all Pie Chart pages:
Pie Charts – Part 1 (Current Page) | Part 2 | Part 3 |
Following is the list of IELTS pie charts (sample 1 to 20) with links to model answers that you should practise for your Academic IELTS test.
IELTS Pie Chart sample 1
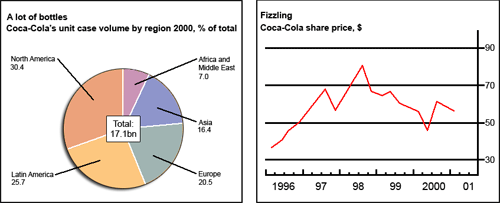
[Information about sales and share prices for Coca-Cola.]
IELTS Pie Chart sample 2
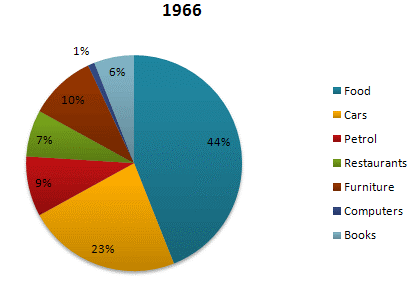
[Expenses in 7 different categories in 1966 and 1996 by American Citizens.]
IELTS Pie Chart sample 3
[Highest level of education of women in someland in 1945 and 1995.]

IELTS Pie Chart sample 4
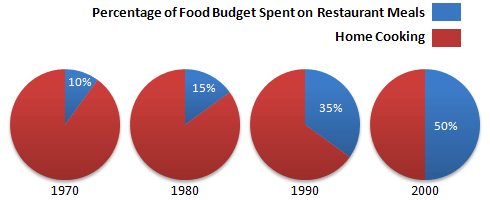
[Food budget average family spent on restaurant meals.]
IELTS Pie Chart sample 5
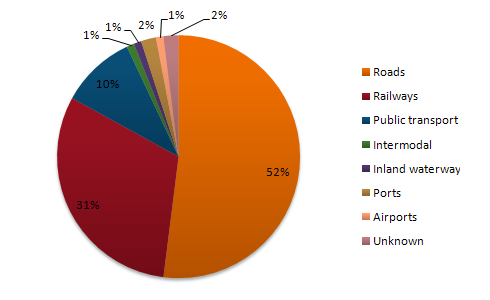
[CO2 emissions for different transport in the European Union.]
IELTS Pie Chart sample 6
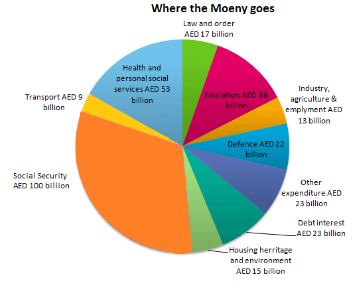
[Information on UAE government spending in 2000.]
IELTS Pie Chart sample 7
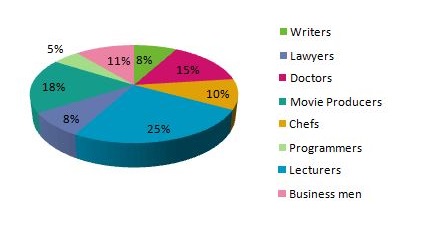
[Hours worked and stress levels amongst professionals.]
IELTS Pie Chart sample 8
[Proportion of families living in poverty in the UK.]

IELTS Pie Chart sample 9
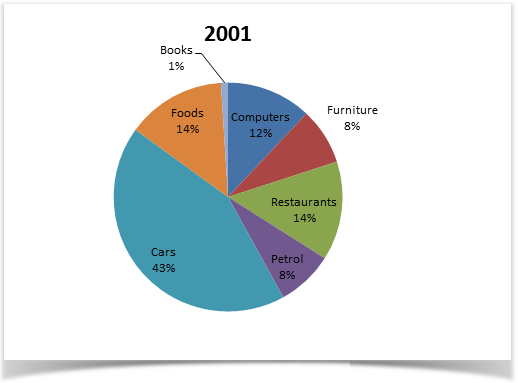
[Changes in spending habits of UK people.]
IELTS Pie Chart sample 10
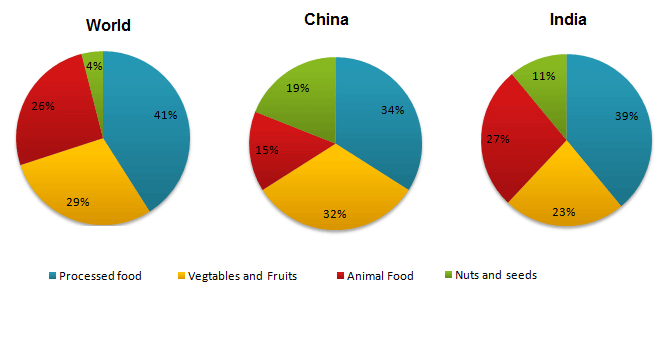
[Consumption of food in 2008 in China and India.]
IELTS Pie Chart sample 11
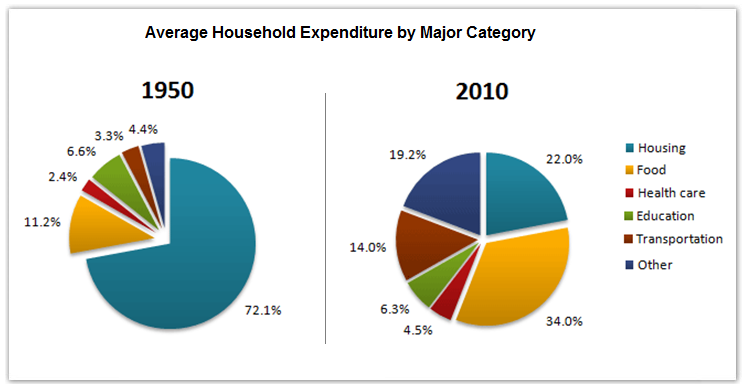
[Average household expenditures in a country.]
IELTS Pie Chart sample 12
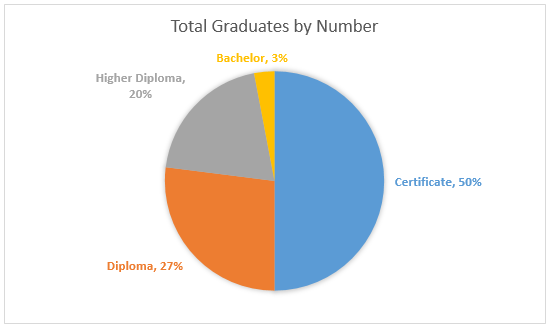
[Enrolment in different colleges in the Higher Colleges of Technology.]
IELTS Pie Chart sample 13
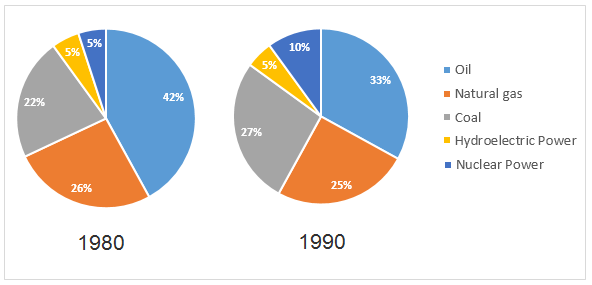
[The two graphs show the main sources of energy in the USA.]
IELTS Pie Chart sample 14
[Data on the spending and consumption of resources.]

IELTS Pie Chart sample 15
[The charts show the result of a survey of adult education.]

IELTS Pie Chart sample 16
[Demand for electricity in England during winter and summer.]

IELTS Pie Chart sample 17
[Units of electricity production by fuel source in Australia and France.]

IELTS Pie Chart sample 18
[Why agricultural land becomes less productive.]

IELTS Pie Chart sample 19
[Changes in annual spending by a particular UK school.]

IELTS Pie Chart sample 20
[Ages of the populations of Yemen and Italy in 2000 and projections for 2050.]

Hi there, I’m here.
It’s very good.
Hey guys! I need a partner to improve my speaking skills. Please contact me.
I need a speaking partner for 7 band score. Please knock me. I spent about 6 months on the preparation of IELTS. My contact number is +923007038980.
Yes.
Can I write more than 200 words?
Hi, I am interested. Actually, I am also looking for a partner.
Hi, everyone. I tend to have a great partner to improve my speaking skills. If there is anyone to assist me please WhatsApp me. My number is 00989105766458.
Thanks for finally writing about >IELTS Pie Chart.
Hi, I have an IELTS exam in 4 months and I need a partner to improve my speaking and writing skill. Anyone who is interested, please let me know.
Love it, please keep this up. Thank you for the hard work. Cheers.
Very nice. Excellent.