IELTS Academic writing task 1 – Table Chart
If you take the IELTS Academic test, you may be given one or multiple tables with data presented in rows and columns in your Writing Task 1 test. You will be asked to write a summary of the table data. A Table Chart (or, simply ‘A Table’) visually presents data in rows and columns. It can display numerical information related to categories, time periods, comparisons between groups and so on. For example, a table may show population growth in different countries, expenditure on various items, or employment statistics across sectors. In this part of the test, your main task is to accurately summarise, describe the key features, identify significant trends, and make comparisons where relevant. Please do not list every number in the table.
When writing an answer for a table chart in your Academic Writing Task 1, it is essential to follow a clear structure: an “introduction” that paraphrases the question, an “overview” that highlights the main trends or makes comparisons, and “two body paragraphs” that explain the details logically. Please avoid copying words from the question and never insert personal opinions.
Links to all Table Chart pages:
Table Charts – Part 1 (Current Page) | Part 2 | Part 3 |
Following is the list of IELTS Table charts (sample 1 to 20) with links to model answers that you should practise for your Academic IELTS test.
IELTS Table Chart sample 1
[The line graph below shows the number of annual visits to Australia by overseas residents. The table below gives information on the country of origin where the visitors came from.]

IELTS Table Chart sample 2
[The first chart below shows the results of a survey which sampled a cross-section of 100,000 people asking if they traveled abroad and why they traveled for the period 1994-98. The second chart shows their destinations over the same period.]

IELTS Table Chart sample 3
[The table below gives information about the underground railway systems in six cities.]

IELTS Table Chart sample 4
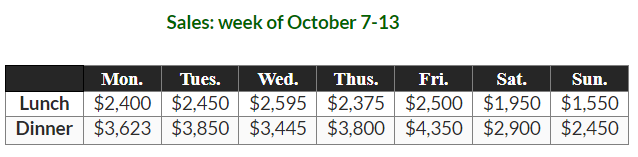
[The table below shows the sales at a small restaurant in a downtown business district.]
IELTS Table Chart sample 5
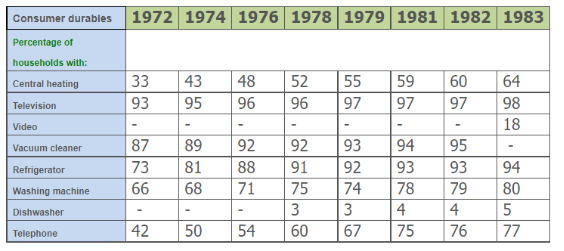
[The table below shows the consumer durables (telephone, refrigerator, etc.) owned in Britain from 1972 to 1983.]
IELTS Table Chart sample 6
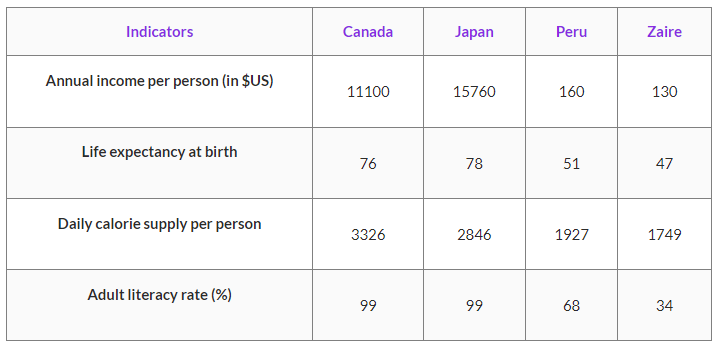
[The table below shows social and economic indicators for four countries in 1994, according to United Nations statistics.]
IELTS Table Chart sample 7
[The chart below shows the sleep patterns of people in five different occupations according to a Canadian study.]

IELTS Table Chart sample 8
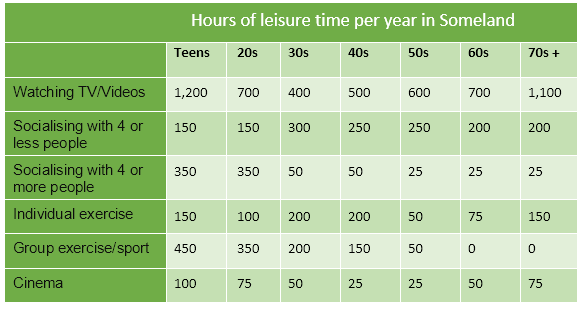
[The table below gives data on the hour of leisure time per year for people in Someland.]
IELTS Table Chart sample 9
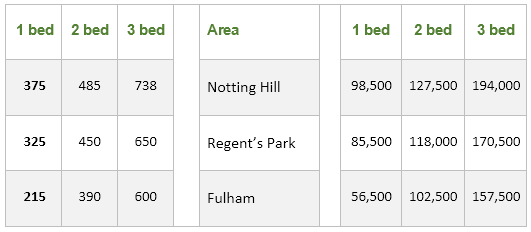
[The table below provides information on rental charges and salaries in three areas of London.]
IELTS Table Chart sample 10
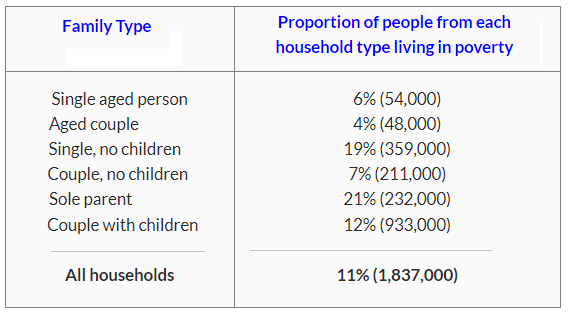
[The table below shows the proportion of different categories of families living in poverty in Australia in 1999.]
IELTS Table Chart sample 11
[The graph below shows the alcohol-related deaths in 7 different countries and the average beer consumption in 2005.]

IELTS Table Chart sample 12
[The table below highlights data on the number of travellers using three major German airports between 2007 and 2012.]

IELTS Table Chart sample 13
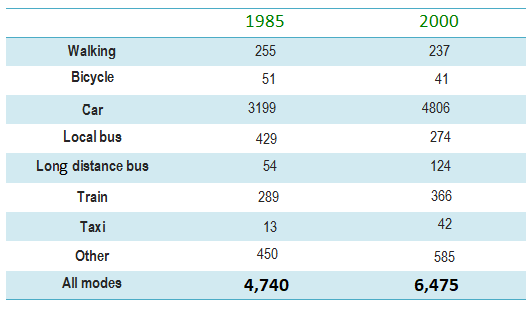
[The table below gives information about changes in modes of travel in England between 1985 and 2000.]
IELTS Table Chart sample 14
[The table below gives information on internet use in six categories by age group.]

IELTS Table Chart sample 15
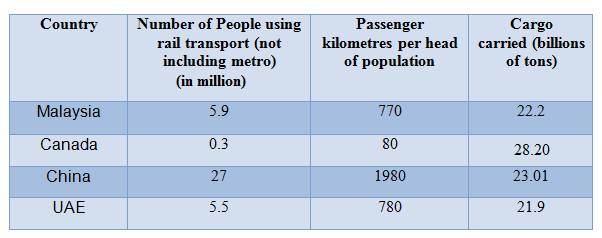
[The table below gives information about rail transport in four countries in 2007.]
IELTS Table Chart sample 16
[The table shows the worldwide market share of mobile phone manufacturers in the years 2005 and 2006.]

IELTS Table Chart sample 17
[The table below shows the number of medals won by the top ten countries in the London 2012 Olympic Games.]

IELTS Table Chart sample 18
[The table below gives information about favourite pastimes in different countries.]

IELTS Table Chart sample 19
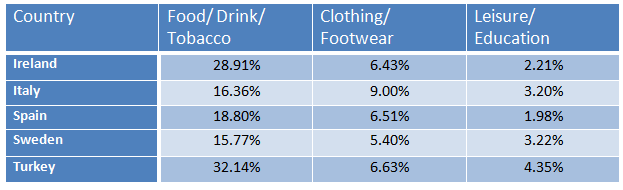
[The table below gives information on consumer spending on different items in five different countries in 2002.]
IELTS Table Chart sample 20
[The pie chart below shows the main reasons why agricultural land becomes less productive. The table shows how these causes affected three regions of the world during the 1990s.]

I want to train in writing and speaking of IELTS.
Good job.
Yes, a single question might consist of more than one tables though it is less likely. You can expect a combination of table and another type of graph.
Please practise more and more to enhance your band score.
Hi, Speaking test: Go to some sites and collect frequently given words such as subject, animals, pollution types.Reading Test: Practise question types- Yes/ No/ NG are in the same order in the paragraph, these are included in IELTS preparation book from British Council. If you know the question types, it is easy to locate answers.Writing: read essays as much as possible. Search some topics via google then you can get ideas. And write them as advantages and disadvantages.Speaking: Go through the speaking topics and collect words.Good Luck ….. Always believe yourself…Thanks, Rash.
Hey IELTS Mentor, I am preparing for my IELTS exam. I have taken it already 3 times but I did not get a good band score ever. I got 5.5 each in modules every time. Please help me with my IELTS examination. My requirement is 6.5 in each module. In the listening test, I listen properly but the main problem is that I make spelling mistakes. In the reading section, I have problems in TRUE/FALSE/NOT GIVEN, the question answer, as well as in fill up the blanks type questions. For writing task, please tell me about writing task 2. In task 2, I don’t have ideas about what I should write and what vocabulary to use. Same problems in speaking tasks – idea generation. Please help me. My email address is kaurh4245@gmail.com. Please send me September speaking Cue Cards topics.
Can there be more than one table in academic writing task 1?
Follow-Ups.
My Telegram number is 009105766458. Contact me as a speaking partner.
Problem in writing task 1 and 2.
Writing part 1.