IELTS Academic Writing Task 1/ Graph Writing – Line Graph + Pie Chart:
You should spend about 20 minutes on this task.
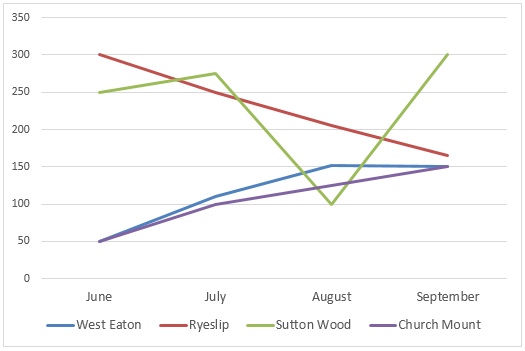
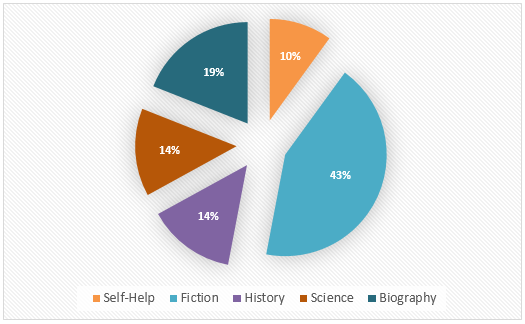
The line graph shows the number of books that were borrowed in four different months in 2014 from four village libraries, and the pie chart shows the percentages of books, by type, that were borrowed over this time.
Summarise the information by selecting and reporting the main features, and make comparisons where relevant.
You should write at least 150 words.
Number of books borrowed from the four village libraries
Types of Books Borrowed
Model Answer 1:
The line graph compares the number of books borrowed from four rural libraries (Ryeslip, Sutton Wood, West Eaton and Church Mount) over four months in 2014 (June to September), while the pie chart shows the proportions of borrowed books by genre during the same period.
Overall, borrowing patterns varied noticeably between libraries. Ryeslip started as the busiest library but declined steadily, whereas Sutton Wood fluctuated sharply and finished as the top lender in September.
In June, Ryeslip issued the highest number of books, at 300, followed by Sutton Wood with 250. This month, people borrowed 50 books from each of the West Eaton and Church Mount libraries. Over the next three months, people’s book borrowing from Ryeslip’s dropped month by month, ending at just over 150 in September. By contrast, Sutton Wood showed the most dramatic changes: although its lending dipped during the middle of the period, it surged to 300 books in September, which was around twice the level recorded by any of the other three libraries at that point. At the same time, more and more people borrowed books from West Eaton and Church Mount libraries, as they experienced consistent growth – from 50 books each in June to 150 by September, mirroring one another throughout.
Turning to genres, most library members preferred fiction books, as this genre accounted for over 40% of all borrowed books. History and science each represented 14%, while biology stood slightly higher at 19%. Self-help made up the smallest share, at 10%, indicating that relatively few borrowers chose this category compared with the others.
Sample Answer 2:
The line graph outlines the number of books people rented from four rural libraries between June and September in 2014, while the pie chart gives data on the kinds of books that were borrowed from those libraries.
Generally speaking, the number of borrowed books fluctuated throughout the months, and fiction was the most popular category among those library goers.
As is presented, people borrowed the highest number of books, 300 to be precise, from Ryeslip library in June 2014. With 250 rentals, Sutton Wood library stood as the second-highest lender of books at that time. West Eaton and Church Mount libraries dispatched 50 books each in June 2014. Interestingly, the number of books borrowed from Ryeslip library declined steadily over the next three months, and in September it forwarded just over 150 books to readers. The most erratic pattern of lending books could be observed for Sutton Wood library, but in September, it allowed 300 books to be borrowed, which was almost double that of other libraries at the same time. Over the months, the book borrowing from West Eaton and Church Mount libraries increased, and they showed a similar lending pattern. They each allowed 150 books to their readers in September.
It is obvious that people mostly borrowed fiction books from these libraries, as more than 40% of borrowed books fell into this category. Borrowing ratio for history and science books accounted for 14% each, and it was 5% lower than that of biology books. Self-help books’ borrowing ratio was exactly 10%, which indicated one in ten books borrowed had this genre.
Thank you so much for such a good website. I hope that I get a good score on my upcoming IELTS test…