IELTS Academic Writing Task 1/ Graph Writing – Pie Chart + Table:
You should spend about 20 minutes on this task.
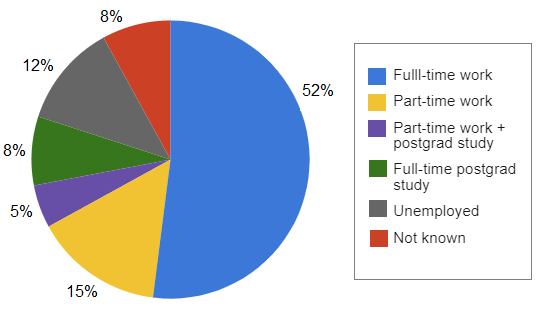
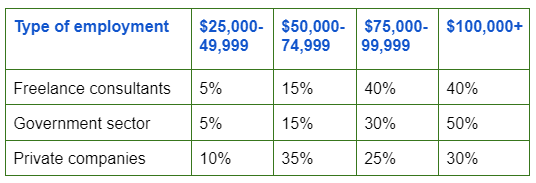
The chart below shows what Anthropology graduates from one university did after finishing their undergraduate degree course. The table shows the salaries of the anthropologists in work after five years.
Summarise the information by selecting and reporting the main features, and make comparisons where relevant.
Write at least 150 words.
Destinations of Anthropology graduates (from one university)
Salaries of Anthropology graduates (after 5 years’ work)
Model Answer:
The bar chart illustrates the career paths of Anthropology graduates from a particular university after completing their undergraduate studies, while the table provides information about the salaries earned by those employed after five years, broken down by employment type and salary range.
Overall, a large proportion of graduates pursued full-time employment, and only a small minority were unemployed. After five years, a large portion of those who were working earned substantial salaries.
According to the pie chart, just over half of all Anthropology graduates secured full-time work, making it the most common outcome. Around 13% continued with postgraduate studies, either full-time or part-time. By contrast, only a small percentage of graduates were unemployed, at roughly 8%, and similarly small proportions took on part-time work or unspecified activities.
The salary data from the table reveal clear differences between employment categories after five years. In freelance consultancy, the majority of anthropologists earned over $75,000, and 40% of them reached the highest income bracket of $100,000 or more. A similar pattern is evident among those in government roles, where nearly half were paid at least $100,000. Meanwhile, those in private companies generally earned less, with most salaries falling between $50,000 and $74,999, and just 30% reaching the top pay bracket.