IELTS Academic Writing Task 1/ Graph Writing – Line Graph:
You should spend about 20 minutes on this task.
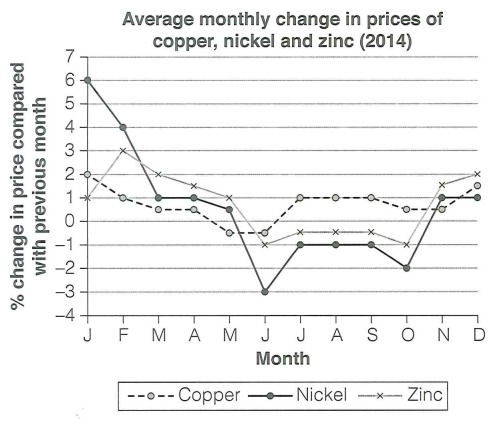
The graph below shows the average monthly change in the prices of three metals during 2014.
Summarise the information by selecting and reporting the main features, and make comparisons where relevant.
Write at least 150 words.
Model Answer:
The line graph illustrates the average monthly price changes of three metals (namely, copper, nickel, and zinc) throughout 2014.
Overall, the price changes of nickel showed dramatic fluctuations with an overall downward trajectory, whereas copper and zinc exhibited more moderate and stable price changes. All three metals’ price changes saw a clear dip around mid-year, followed by a partial recovery toward the end of 2014.
In detail, nickel’s average price surged by around 6% in January 2014, its highest monthly gain, before falling sharply to roughly 1% by March. After a brief plateau, its price change tumbled to an average of negative 3% in June, the year’s lowest point, and then recovered to around -1% from July to September. In October, it dropped again to approximately -2%, but then rebounded to finish the year with a modest increase of 1% in both November and December.
Zinc’s price change began at 1% in January, peaked at 3% in February, and then declined slowly, reaching -1% in June. From then until October, its monthly change hovered just above or below zero, before rising again to 2% by December. Meanwhile, copper showed the least volatility: its price change started at 2% in January 2014, gradually declined to just below zero around June, then rose back to around 1% for several months between July and September. By December, copper’s price change had settled at about 1.5%.