IELTS Academic Writing Task 1/ Graph Writing – Line Graph:
You should spend about 20 minutes on this task.
The graph shows children by age group as a percentage of the young population in the United Kingdom between 1990 and 2001.
Summarise the information by selecting and reporting the main features, and make comparisons where relevant.
You should write at least 150 words.
Model Answer 1:
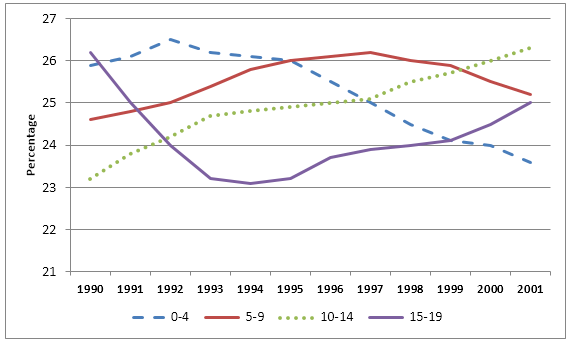
The line graph illustrates how the proportions of four age cohorts (0-4, 5-9, 10-14, and 15-19) changed as a percentage of the young population in the UK over the period from 1990 to 2001.
Overall, there is a clear divergence in trends among the age groups: the youngest children (0-4) steadily declined in their share, while the 10–14 age bracket experienced a continuous rise and ultimately became the largest proportion of the young population by the end of the period. The 5-9 and 15-19 groups exhibited more modest fluctuations.
In 1990, infants (0-4) and older adolescents (15-19) each made up just over a quarter of the youth demographic. Children aged 5 to 9 accounted for approximately 24%, and 10–14 year-olds were the smallest group at 23%. During the first two years, the percentage of 0–4-year-olds briefly increased before embarking on a gradual decline, ending the period at slightly above 23%. In contrast, the 10-14 cohort rose steadily throughout the decade and approached the mid-26% range by 2001.
Meanwhile, the proportion of children aged 5-9 peaked around the mid-1990s (1995-1997) at just over 26%, but then decreased somewhat to finish at slightly more than 25% in 2001. The 15-19 age group dropped in the early 1990s, bottoming out around 1994, then made a modest recovery and ended roughly where it started, close to 25%.
Sample Answer 2:
The line graph presents data on the proportion of children with respect to the total young population in the UK between 1990 and 2001. The proportion of children is categorised in four age groups. Overall, the ratio of infants, between 0 to 4 years old, declined over the period while 10 to 14 years youngsters’ percentage increased in the UK.
As can be seen in the diagram, just over a quarter of the UK children were 15 to 19 years old in 1990, while a similar proportion was 0 to 4 years old at that time. Just over 24% of young Britons were between 5 to 9 years old, while 23% of them were 10 to 14 years old. With an increase from 1990 to 1992, the proportion of infants kept on decreasing, and in 2001 accounted for over 23% of the total youth. With a steady slump till 1996, 15-19-year-olds constituted a quarter of young Britons in 2001.
Moving further, 10-14 years British dominated the young generation in the UK with a steady increase in their percentage in later years despite their smallest proportion in the early years. Finally, 5-9-year-old British children were over 26% during 1995-1997, but their ratio declined and finally stood at just over 25% in 2001.
The line graph illustrates how the young population in the UK varied during the 1990s comparing their ratio throughout a decade. Overall the trend shows that the ratio of toddlers among the young generation witnessed a decline, while the 10-14 years youngsters’ percentage had seen an increase over time.
The detailed analysis shows that the ratio of infants (babies between 0-4 years old) declined in the UK over time. Their ratio among the youth in the UK was just below 26% in 1990 which dropped to somewhat 23.5% after a decade. In contrast, children between 10 to 14 years witnessed a positive growth rate in terms of their percentage change for the same time period and went above 26% in 2001.
The other striking feature is the drastic slump in the population of British teenagers (15 to 19 years old) for the period from 1990 to 1994 when it touched a low ceiling of almost 23% from a healthy 26%. However, it grew again thereafter and returned to 25% per cent.