IELTS Academic Writing Task 1/ Graph Writing – Line Graph:
You should spend about 20 minutes on this task.
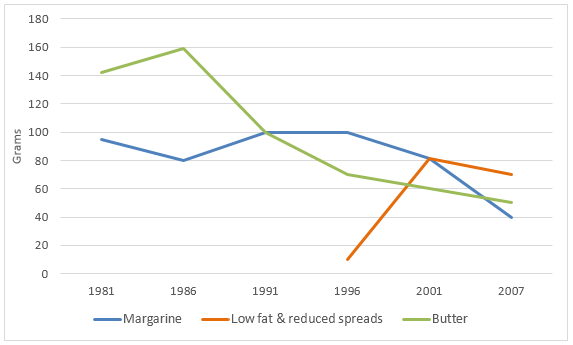
The graph below shows the daily consumption of three spreads per person from 1981 to 2007 in a country.
Summarise the information by selecting and reporting the main features, and make comparisons where relevant.
You should write at least 150 words.
Model Answer 1:
The line graph illustrates daily per-person consumption of three different spreads, namely butter, margarine, and low-fat spreads, in a country between 1981 and 2007. The per-person consumption is presented in the graph in grams.
As the data suggest, the consumption of both butter and margarine declined markedly over the period, while reduced-fat spreads, introduced in the mid-1990s, rose sharply to become the most popular by 2007.
In detail, an average person in this country consumed just over 140 grams of butter in 1981, and the intake rose to a peak of approximately 160 grams by 1986. After this apex, average butter consumption fell steadily, finally dropping to around 50g by 2007. On the other hand, they ate roughly 98g of Margarine in 1981. This consumption trend showed some moderate fluctuations throughout the 1980s and early 1990s. After 1996, the consumption of Margarine fell considerably, ending at about only 40g per person per day in 2007.
Low-fat and reduced spreads were not present on the graph until 1996, when their daily consumption was just 10 grams. From there, its usage accelerated sharply, peaking at roughly 80g in 2001. Although there was a slight decline in the later years, by 2007 their consumption remained high, which was around 70g, surpassing both butter and margarine.
Sample Answer 2:
The consumption of margarine, butter and low-fat spreads in a country from 1981 to 2007 is compared in the line chart from 1981 to 2007. The daily intake is measured in grams.
It is apparent that low-fat & reduced spreads have been in use since 1996, while the other two types were preferred from much earlier, but soon the former became the most preferred spread type in this country.
As the data suggests, butter was the most consumed spread type in 1981, with slightly over 140 grams of daily intake. Consumption of margarine in this year was just below 100 grams. After 5 years, the use of butter rose while it actually decreased for margarine. But both of their daily consumption intersected in 1991 as the demand for margarine remained steady till 1996, at which point butter consumption dipped as low as 65 grams per person. The use of butter steadily declined after 1986. The ‘low-fat and reduced spread’ was introduced in 1996, and it soon became the most consumed spread type with a sharp rise in its use. In 2001, the demand for the latter spread reached as high as 80 grams, while the other two spreads were losing their demand. Finally, in 2007, people consumed around 70 grams of low-fat and reduced spreads, and consumption of butter and margarine was around 45 and 40 grams, respectively, at that time.
Model Answer 3:
The line graph compares per day consumption of three different spreads – ‘margarine’, ‘low fat & reduced spreads’, and ‘butter’ in a country between 1981 and 2007. Daily per-person consumption has been measured in grams.
Overall, the consumption of all spreads declined significantly from 1981 to 2007, with the exception of low-fat & reduced spreads.
Looking into detail, butter was the most preferred spread with 141 grams per day per person consumption in 1981. Consumption of margarine and low-fat & reduced spreads was 99 grams and just 10 grams, respectively, in the same year. While the consumption of butter dropped remarkably afterwards, people started to consume less amount of margarine as well. However, the intake of low-fat and reduced spreads increased drastically and reached the peak of 80 grams in 2001, and became the most consumed spread in 2007.
The consumption of butter and margarine decreased dramatically over a period of 28 years. In detail, butter’s consumption rose steadily and touched a high of 170 grams per capita in 1986, but after that, it decreased continuously and reached nearly 55 grams by 2007. Similarly, margarine showed the same trend with some fluctuations, decreasing from 100 grams to 80 grams between 1979 and 2007.
[Written by – Vicky]
The line graph depicts the amount of three kinds of spreads which were consumed between 1981 and 2007.
Overall, it is evident that while butter and margarine consumption was declining, low-fat and reduced spread consumption was increasing more than the other two at the end of the year. Butter had the most popular consumption of spreads at the beginning of the year, and margarine had the lowest consumption at the end of the year.
With regard to butter, it commenced at around 140 grams and then peaked at 160 grams in 1986 before dropping dramatically to about 51 grams in 2007. Likewise, approximately 90 grams of margarine was eaten in the first year, after which the figure fluctuated slightly and declined to a low of 40 grams in the last year.
Regarding low fats and reduced spreads, they only started at about 10 grams in 1996. Then, it reached a high of 83 grams in 2001, and plunged modestly in the final years to approximately 70 grams in 2007.
The given line chart displays the changes in daily consumption of margarine, butter and low-fat and reduced spreads of a country in a 16-year period.
Overall, it is observed that the usage of the latter type of spread rose as the two others saw a decline throughout the years. More specific information will be summarized below.
To begin with, the diagram suggests that in 1981, an average person ate approximately 140 grams of butter every day while the figure for margarine was almost 100 grams.
16 years later, however, both had a dramatic decrease to become 50 and 40 grams per person consumption, respectively. Interestingly, the data also points out that from 1992 to the early 2000s, consumption of margarine was higher than that of butter, as the former had a steadier figure while the other dipped continuously at the same time.
In sharp contrast, it was only in 1996 that low-fat and reduced spreads were introduced. As can be seen, only 10 grams was consumed per person per day this year. However, there was a surge when the amount became eight times as much in 2001. Despite a slight decrease in the following years, low-fat and reduced spreads were eaten the most by the end of the period. Compared with 50 grams of butter and 40 grams of margarine daily per person, the amount of low-fat and reduced spreads was 70 grams.