IELTS Academic Writing Task 1/ Graph Writing – Bar/ Column Graph:
» You should spend about 20 minutes on this task.
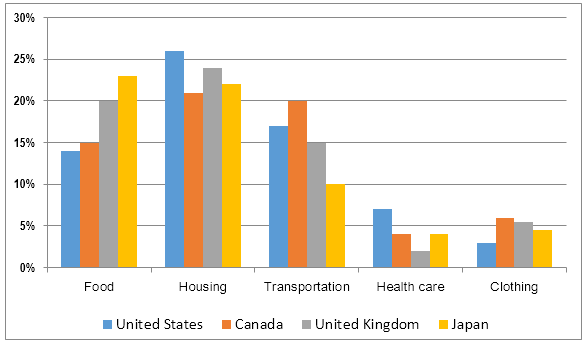
The bar chart below shows shares of expenditures for five major categories in the United States, Canada, the United Kingdom, and Japan in the year 2009.
Summarise the information by selecting and reporting the main features, and make comparisons where relevant.
You should write at least 150 words.
Shares of expenditure for selected categories, United States, Canada, United Kingdom, and Japan, 2009
Model Answer 1:
The bar chart compares the shares of household expenditure in 2009 across five categories – food, housing, transportation, health care and clothing – in the United States, Canada, the United Kingdom and Japan.
Overall, housing and food accounted for the largest proportions of spending in all four countries, while health care and clothing accounted for the smallest shares. The Japanese population spent the most on food, whereas in the United States, the highest proportion of citizens’ expenditure went on housing costs.
Looking first at food expenditures, Japan recorded the greatest share of expenditure on food at about 23%, compared with roughly 20% in the UK and around 14–15% in both the USA and Canada. Housing represented the biggest expense in three countries, peaking in the United States at just over a quarter (around 26%), while people in Canada, the UK and Japan each spent roughly 21–24% on accommodation.
Spending patterns for transportation were also distinct. It was the highest in Canada, where citizens allocated the highest proportion, at around 20%, whereas Japan spent the least, at about 10%. The spending on commuting in the USA and the UK fell in the middle, with figures of approximately 17% and 15%, respectively.
Finally, the least share of expenditures by the people in these three countries was for health care and clothing. Expenses for clothing and dresses remained steady at around 3-5% across all four nations. Health care accounted for a slightly larger proportion of their costs, led by the USA at about 7%, while the UK spent the least, at only around 2–3%.
Sample Answer 2:
The column graph compares how much Americans, Canadians, English, and Japanese spent on food, housing, transportation, healthcare and clothing in 2009.
Generally speaking, housing and food cost more money to these nationalities than other expenses this year.
As is given in the column graph, the Japanese spent around 23% money on food, and this ratio was higher than that of other nationalities. UK residents’ spending on food was one-fifth of their total expenditure, while it was less than 15% for Americans and Canadians. Housing, on average, demanded the highest percentage of money, and it was more expensive in the United States, as more than one-fourth of their money went on arranging accommodation. All other nationalities had to spend between 20% – 24% for housing.
Transportation cost, on the other hand, was highest in Canada, and one-fifth of spending by Canadians was for commuting. Japanese people spent the least on commuting, and it was 10% of their expenses. Interestingly, these nationalities spent around 5% money on clothing, which was slightly higher than their medical expenses. US citizens had to spend the highest on healthcare, which accounted for around 7% of their total costs, while it was the lowest in the UK, just around 2%.
Perfect. Maybe band 8.5.