IELTS Academic Writing Task 1/ Graph Writing – Pie Chart:
» You should spend about 20 minutes on this task.
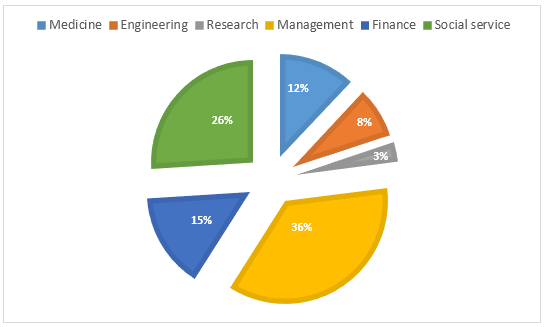
The pie chart below presents the percentage of new job opportunities for different professional groups in Australia in the year 2001.
Write a report for a university lecturer describing the information shown in the diagrams below.
You should write at least 150 words.
New job openings in Australia in 2001
Model Answer 1:
The pie chart illustrates the proportion of new job openings available to various professional groups in Australia in 2001. The data are presented as percentages of the total number of vacancies.
Overall, there was a marked concentration of opportunities in a few sectors, with management positions clearly dominating the job market. In contrast, fields such as engineering and research offered relatively limited openings.
According to the chart, management roles accounted for the largest share of new jobs, representing 36% of the total. This was significantly higher than any other category, indicating strong demand for managerial skills at that time. The social service sector had the second largest share, at roughly 26%, suggesting that community-focused professions also offered a substantial number of openings.
The next most significant sector was finance, which comprised 15% of the new positions, followed closely by jobs in medicine at about 12%. These figures imply that the financial and healthcare sectors were important but not as dominant as management or social services.
By comparison, engineering opportunities were noticeably fewer, at around 8%, while research roles were the least available, making up only 3% of all new job openings.
Sample Answer 2:
The provided pie chart depicts new employment opportunities in Australia for different professional groups in 2001.
Generally speaking, the highest job opening was for job seekers in the management group, while engineering and research-related job openings were considerably fewer this year in Australia.
According to the illustration, 36% of total job opening was in the management sector in Australia in 2001, and this ratio of new jobs was higher than in any other sector. Approximately one out of every four jobs was related to social service, while around one out of seven jobs was in the finance sector. Furthermore, medicine specialists had 12% jobs to apply to, while only 8% and 3% of job announcements were for engineers and researchers, respectively. It is noticeable that fewer jobs related to research, only 3%, were announced in 2001 in Australia, while management and social service jobs comprised the highest ratio, more than 60%, of the new job openings in this year.
Model Answer 3:
The pie chart presents the profession-wise new job opening ratio in 2001 in Australia. The job openings were classified in six broad categories, including medicine, engineering, research, management, finance and social service.
Overall, management jobs comprised the highest number of new jobs in Australia, while research-related job announcement was the lowest.
According to the given pie chart, 36% fresh jobs were looking for management staff, which covered the highest ratio of new jobs in Australia in 2001. Next to management job openings were social service jobs, which accounted for roughly one-quarter of fresh jobs this year. The finance sector’s job opening accounted for 15% of total job advertisements, which was 3% higher than that of medicine specialists’ jobs. Interestingly, engineers had only 8% jobs to apply to, and this was significantly lower than that of management and social service job openings. Only three out of one hundred job reporting was for researchers in Australia. It is interesting to notice that specialists like engineers and doctors had significantly fewer jobs to apply to in 2001 in Australia.
The provided pie chart shows the proportions of prospective new jobs in six different job categories in Australia, throughout the year 2001.
A quick look at the graph suggests that there were higher opportunities for those who belonged to the management group while the chances in engineering and research jobs in Australia were considerably lower.
According to the diagram, management-related jobs accounted for 36% of new job openings, which was exactly triple than that of finance-related occupations. Then approximately a quarter was represented by the social service group and for medicine sector, the figure stood at 12%.
For professions relating to engineering and research, they accounted for sequentially eight and three per cent. The total combined percentage of these two sectors was still less than the figure for medicine, which was the third smallest of all. And it is also worth noticing that management and research jobs differed more than 30% while opportunities in the social service sector almost equalled the combination of those job in finance and medicine.