IELTS Academic Writing Task 1/ Graph Writing – Bar Chart:
» You should spend about 20 minutes on this task.
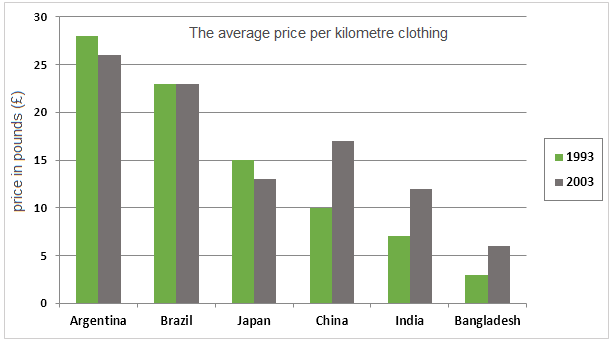
The average prices per kilometre of clothing imported into the European Union from six different countries in 1993 and 2003 are shown in the bar chart below.
Summarise the information by selecting and reporting the main features, and make comparisons where relevant.
You should write at least 150 words.
Model Answer 1:
The bar chart compares the average price per kilometre of clothing imported into the European Union from six countries – Argentina, Brazil, Japan, China, India and Bangladesh – in 1993 and 2003, measured in pounds sterling.
Overall, Argentina remained the most expensive source of imported clothing in both years, while Bangladesh was consistently the cheapest.
A second clear pattern is that prices rose sharply for several lower-cost suppliers, particularly China and India, whereas the costs of imports from Argentina and Japan declined slightly.
In 1993, the EU paid the highest rate to Argentina, at roughly £28 per kilometre of garment items, followed by Brazil at about £23. Japan occupied the middle position at approximately £15, while China was lower at around £10. The cheapest imports came from India (about £7) and Bangladesh (just under £3).
By 2003, Argentina still topped the chart despite a fall to a little above £25 of their rate, and Brazil stayed steady at about £23. A significant change occurred in the price of Chinese garments imported to the EU. The rate climbed to around £17, overtaking Japan, which slipped slightly to roughly £13. India recorded another major increase, almost doubling to about £13, while Bangladeshi garments import price also rose noticeably to around £6, although it remained the cheapest supplier of garments.
Sample Answer 2:
The column graph compares the prices the European Union paid to six countries for importing per-kilometre clothing in 1993 with those in 2003. Overall, the EU paid the highest amount to Argentina for per km garments, and the lowest to Bangladesh in both years.
As can be seen in the illustration, the European Union paid around 28 pounds per kilometre for clothes from Argentina in 1993, and this rate was the highest among the listed countries. After a decade, it reduced by 3 pounds, but still, Argentina received the premier price for clothing export to the EU. The second-highest price paid by the EU for per-km clothes from Brazil, and both in 1993 and 2003, Brazil was paid roughly 23 pounds for one kilometre of garments. Japan received exactly 15 pounds for that in 1993, but this rate dropped to roughly 13 pounds after 10 years. China was paid 10 pounds in 1993, and the price hiked to about 17 pounds in just ten years. The EU purchased Indian garment items for approximately 7 pounds per km in 1993, and the price doubled in a decade. The least amount per kilo of clothing imported was paid to Bangladesh by the EU in both years, but the price went high in 2003 and was 6 pounds compared to half of that in the previous decade.
Sample Answer 3:
The bar graph shows the average price the European Union (EU) paid per kilometre of clothing from six different countries in 1993 and 2003. It is obvious that the EU paid the highest amount for each kilometre grament products to Argentina and the lowest to India and Bangladesh.
According to the illustration, the EU paid the highest amount for clothing imports from Argentina, which was approximately 28 pounds per kilometre in 1993. This rate was significantly higher, almost 9 times higher than the rate it gave to Bangladesh. The second and third highest rates were given to Brazil and Japan, roughly 23 and 15 pounds, respectively. China and India got less than that, and their rate was higher than the import rate from Bangladesh. The latter received only around 3 pounds per kilo, which was almost three times less than the rate paid to Japan.
The rate went higher in 2003 for China, India and Bangladesh, which were the least paid countries a decade earlier. The price for costume imports from Brazil remained unchanged, while slightly declining for Argentina and Japan. Despite the price changes, Argentina and Brazil were still paid higher than India and Bangladesh, while China’s price went as high as 17 pounds, almost double the rate they received a decade earlier.
The bar graph shows the gradual increase in population in urban and rural communities in five of the world’s largest cities. The rates are broken by years and cities.
Expectedly, every city in the graphic experienced a rise in population but with divergencies in rates of the population increase and current number of inhabitants.
In detail, the population increase is a lot bigger in Jakarta and Bombay than in New York. The city of Jakarta went from having an urban population of not more than two million to approximately nineteen million in forty years, bypassing New York City. Massive population growth is also seen in Bombay which has seen its number of people rise by five times. It’s also visible that the two South Asian cities have had a much smaller urban population in the past compared to fully-developed metropolitan centres such as New York or Tokyo, which had witnessed a smaller population increase over the years.
Going over to East Asia, we see a population rise on a smaller scale, with both Tokyo and Shanghai having a similar, fairly stable rate of widening population. The smallest rate, however, goes to New York City with a concerningly small difference in forty years.
The bar graph depicts the average prices per kilometre of clothing that the European Union (EU) paid to six countries between 1993 and 2003. Overall, for both years, it is apparent that the EU imported clothing garments from Argentina at the highest price while it was the lowest from Bangladesh.
In 1993, the EU paid the highest amount for per kilometre clothing to Argentina, which was around 28 pounds. This was followed by the payment made to Brazil, 23 pounds per kilometre. In contrast, the prices paid to the other four countries were lower than that. The prices of clothing imported from China and Japan were just 10 and 15 pounds per km, respectively. The average price from India was much lower, 7 pounds, and the cheapest price for clothing was from Bangladesh, which was at only 2.50 pounds.
By 2003, the price of clothing imported from Argentina slightly decreased by 2 pounds while Brazil’s figure remained steady. Also, the price of EU’s imported clothing from Japan declined. However, prices in the other three countries rose by a substantial amount. China’s clothing price dramatically moved upward to 17 pounds as well as in India, it rose to 12 pounds. The lowest figure in 2003 was from Bangladesh which only accounted for 6 pounds per kilometre.
Hey, in both the answers, where is the overall paragraph?
Secondly, in the sample answer 2, the year (1993) was not specified. Finally, from the graph, I think Argentina received about 10times (not 7 times) higher than the rate Bangladesh got from the EU in 1993. Need clarification on this. Thanks.
This is the best website I have ever come across since my IELTS world. As regards sample answer 1, the details were lumped in only one paragraph. Hope it won’t reduce the band score?
Can we use “of” and “per” together as it used in the first line of Sample Answer 1? “The column graph compares the import prices of per kilometre clothing by the European Union” or we should use it in this way: “The column graph compares the import prices per kilometre clothing by the European Union” or “The column graph compares the prices per kilometre of clothing imported by the European Union”?
The bar chart provides information about the average cost per kilometre of clothing spent in pounds by the European Union on clothing import from Argentina, Brazil, Japan, China, India and Bangladesh in 1993 and 2003.
It can be clearly seen that the EU had paid the highest amount of money to Argentina, whereas the lowest amount was being paid to Bangladesh, in both the years.
According to the bar chart, Argentina had the highest clothing price in terms of selling them to the EU nations, approximately 28 pounds in 1993, which noticed a slight drop in 2003 to just above 25 pounds. But still, it remained at the pinnacle of price earned from their clothing making. The second and the third highest amount was paid to Brazil and Japan, roughly 23 and 15 pounds, respectively. China, India and Bangladesh received less price (less than 10 pounds) compared to the other three countries in 1993.
The average cost went up for India, China and Bangladesh in 2003, compared to a decade back. Even though there was a slight drop of approximately 2 pounds in the cost of clothing for Argentina and Japan, they still stood the first and the second places respectively. China’s per kilometre costumes export almost doubled in 2003, while it remained unchanged for Brazil.
[quote name=”Saloni”]Has clothes been imported to EU or by EU?[/quote]Into european union.
Has clothes been imported to EU or by EU?
Thank you for this website and all these examples. Can it be used “AMOUNT” instead of “rate” in the first sentence of the second paragraph? (As is seen, the European Union paid around 28 pounds for per kilometre clothes from Argentina in 1993 and this RATE/AMOUNT was the highest.)