IELTS Academic Writing Task 1/ Graph Writing – Line Graphs:
» You should spend about 20 minutes on this task.
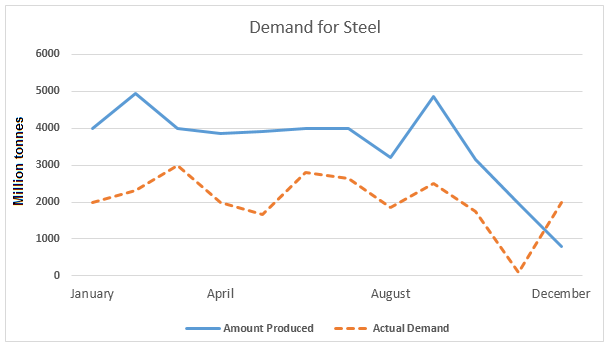
The line graphs below show the production and demand for steel in million tonnes, and the number of workers employed in the steel industry in the UK in 2010.
Summarise the information by selecting and reporting the main features, and make comparisons where relevant.
You should write at least 150 words.

Model Answer 1:
The two line graphs illustrate changes in steel production and demand in the United Kingdom during 2010, along with the number of workers employed in the steel industry over the same period.
Overall, steel production exceeded demand for most of the year, but the gap narrowed towards the end, when demand finally overtook output. At the same time, employment in the steel sector declined sharply, showing an overall downward trend with fluctuations.
At the beginning of 2010, the UK produced around 4 million tonnes of steel, while demand stood at approximately half of that. During the first half of the year, both figures remained relatively stable, as production remained almost the same, roughly 4 million tonnes by mid-year. Demand followed a similar but slightly lower pattern, staying close to 2 to 3 million tonnes for much of this period.
In September, production rose sharply to 5 million tonnes again, when demand was only 2.5 million tonnes. Afterwards, production dropped steeply and noticeably, falling to below 2 million tonnes by November. Demand also declined. By December, demand grew while production continued to fall, resulting in demand surpassing production for the first time in the year.
The employment graph shows a contrasting but related trend. The steel industry employed about 5 million workers at the start of the year. This figure fell dramatically by late March, and continued to fluctuate before declining steadily towards the end of the year. By December, the workforce had shrunk to roughly 1 million employees, representing a significant contraction in the sector.
Sample Answer 2:
The first line graph compares steel production and demand in the UK in 2010, while the second one reveals the number of employees in the industry in the same year.
Overall, steel production was higher throughout the year than their demand, except in December, and more employees were employed in this industry at the beginning of the year than the rest of the year.
According to the first graph, the UK produced 4,000 million tonnes of steel in January 2010, and at that time, demand was exactly half of that. After the first quarter, production and market demand of steel remained almost the same, with a spike in late February. At the end of the second quarter (August 20101) UK’s steel production stood at just over 3 thousand million tonnes against a million tonnes less demand. From January to November, production was higher than demand, and the gap was a million tons, on average. However, the scenario shifted dramatically at the end of the year. From September to November, steel production plummeted, and so did the demand. In December, demand for steel in the UK exceeded the total production.
The second line graph reveals that 5 million employees worked in the steel industry, and their number dropped by two million in early April. From that time onward, the employee number showed some fluctuations, and in August, the UK steel sector employed around 3.5 million workers. This number continuously dropped throughout the rest of the year and declined to just 1 million in December.
Sample Answer 3:
The line graphs compare steel production and market demand in the UK in 2010. It also shows the number of workers employed in this sector.
Generally speaking, production of steel in the UK was higher than demand throughout the year, except at the end of the year, and the number of workers employed in this sector was proportionate to production capacity.
In detail, at the beginning of 2010, the demand for steel was 4,000 million tonnes in the UK, which was double than the actual demand. Production increased in February, and the demand grew in late March. Steel production and demand in April remained almost the same as they were in January. However, in August, at the end of the third quarter, demand remained almost unchanged, but production dropped to just over 3,000 million tonnes. Afterwards, demand dramatically fell in November, and by December, it went up, exceeding the production quantity. During this time, the demand for steel was 2,000 million tonnes against less than 1000 million tonnes production.
It is worth noting that the production of steel is correlated with the number of employed workers in this sector. In January 2010, the steel industry in the UK employed 5 million workers, and it went as high as roughly 5.8 million in February, which implies a higher production of steel at the same time. From March to July, their number stood at an average of 2 million, and kept on declining from September to December – again reflecting the production quantity. At the end of the year, the UK steel sector employed only 1 million people, when only 1000 tonnes of steel were produced.
Model Answer 4:
The first line graph presents a comparative analysis of the market demand and production of steel in the UK in 2000. The second graph shows the total number of workers employed in this industry in the same year.
Overall, the steel production in the UK in 2010 exceeded the demand, except at the end of the year, and the number of employee enganged in steel production naturally reflects the total production quantity.
In detail, steel production in the UK in 2000 exceeded the demand. In the first quarter of the year, the actual market demand for steel started at 2000 million tonnes in January, but production was twice that amount, with a continuous rise. Later, in April, demand started to fall, but production kept on growing and reached 5,000 million tonnes. Moreover, demand showed further fluctuations until November and fell to almost zero, whereas production of the steel attained a plateau for some time with further variations, and started falling later. After that, in December, the demand was nearly double that of the production.
From the second graph, it is evident that the total number of workers in the steel industry in the UK was 5 million in January, and it rose for a month or so. But it then showed a sudden plunge and reached 3 million by April, with further fluctuations until August. However, the number of workers continued to fall and reached 1 million by the end of the year.
[Written by – Divya]
I agree. They kept saying in millions instead of thousands.
The unit for the second graph is in thousand.
Sample Answer 2 (correction)….During this time the *production* of steel was 2000 million tonnes against less than 1000 million tonnes production….During this time the *demand* for steel was 2000 million tonnes against less than 1000 million tonnes production.