IELTS Academic Writing Task 1/ Graph Writing – Bar Graph + Pie Charts:
You should spend about 20 minutes on this task.
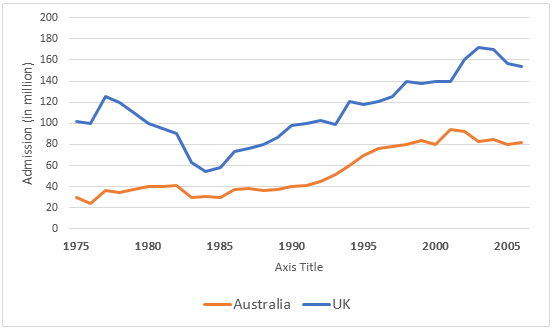
Charts A and B show the share of the UK and Australian cinema market in 2001 and cinema admissions in the UK and Australia from 1976 to 2006.
Write a report for a university lecturer describing the information shown below.
You should write at least 150 words.
Chart A: Films screened in the UK and Australia, 2001.
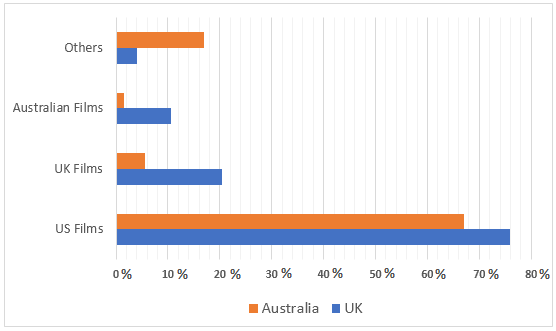
Chart B: UK and Australian cinema admissions, 1976 to 2006.
Sample Answer 1:
The bar chart presents data on the origin of films which were screened in Australia and the UK in 2001, while the line graph compares the number of cinema attendants in these two countries between 1976 and 2006.
Overall, Australian and British theatres were dominated by American movies from 1976 to 2006, and more British went to movie theatres than their Australian counterparts between 1976 and 2005.
As the data suggests, more than 75% movies that were released in UK theatres in 2001 were produced in the USA, while just one-fifth were locally made. Besides, almost one in ten movies screened in the UK was produced in Australia. A similar movie screening trend could be observed in Australia this year, where American movies dominated the theatres with a 65% ratio. Australians could watch fewer UK-made movies as only one in twenty British films made it to Australian halls. Interestingly, locally produced films in Australia were insignificant in percentage, as their screening ratio suggests.
It is obvious that more Brits enjoyed cinemas in a theatre than Australians did between 1976 and 2005. In 1975, over 100 million British citizens watched movies in halls, while it was just around 30 million in Australia – a significantly lower number. With some fluctuations, Australian movie-goers reached over 80 million after 3 decades. On the contrary, British cinema attendees dropped from 1977 to 1984, but afterwards steadily soared with some minor fluctuations. After 30 years, almost 160 million British people went to cinema halls – almost double the number of Australian moviegoers.
Model Answer 2:
The two charts compare the origin of films screened in the United Kingdom and Australia in 2001 (Chart A) and track cinema admissions in each country from 1976 to 2006 (Chart B).
Overall, films from the United States overwhelmingly dominated both the UK and Australian markets in 2001, while admissions in both countries show an upward trend over the 30-year period, with the UK consistently attracting significantly more movie-goers than Australia.
Turning to Chart ‘A’ – which is a bar graph, it is obvious that American productions accounted for the major share of the market in both the United Kingdom and Australia. It was slightly higher in the UK than in Australia – 75% and 67%, respectively. In contrast, locally produced films fared very differently: UK-origin films comprised a substantial segment in the UK cinema market (20%), whereas Australian-made films captured only a small fraction of their domestic market (below 2%). It is worth noticing that Australian-produced films got a higher percentage of screenings in UK halls (11%) than they did in their own country (below 2%). The “other countries” category was noticeably larger in Australia, indicating a more diverse foreign film presence there than in the UK.
Chart ‘B’ – which is a line graph – reveals a more dynamic pattern. In the UK, admissions plunged in the mid-1980s to below 60 million from a significantly higher number of 122 million admissions the previous decade. It then embarked on a robust recovery and growth phase that steadily climbed, culminating in a peak around the mid-2000s with a number of over 160 million cinema attenders in a single year. Australia, meanwhile, experienced a steadier, less volatile increase in admissions, rising gradually from modest levels in the late 1970s (around 30 million moviegoers) to a significantly higher figure by 2006 (over 80 million). But their number were always well below the UK total.
It’s very helpful for me.
Very good and useful.