IELTS Academic Writing Task 1/ Graph Writing – Line Graph:
You should spend about 20 minutes on this task.
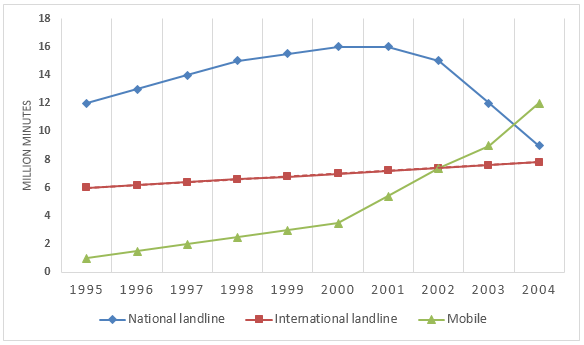
The chart below shows the total volume of telephone calls (in million minutes) in Denmark, divided into three categories, from 1995-2004.
Summarise the information by selecting and reporting the main features, and make comparisons where relevant.
You should write at least 150 words.
Sample Answer 1:
The line graph compares the duration of national landline, international landline, and cell phone calls made by Denish citizens between 1995 and 2004.
Generally speaking, the use of mobile phones by Danes increased remarkably after mid-2000, while the use of national fixed lines declined steeply after 2001.
As the diagram suggests, national landline calls by Danes accounted for almost 12 million minutes in 1995, at which point Danes dialled about 6 million minutes of international calls, and fewer than one million minutes of calls using mobile phones. The duration of conversations made by mobile phones gradually grew till the mid-2000s, after which it skyrocketed till the mid-2004. Danes made more than 2 million minutes of mobile calls during 2000, while it soared to approximately 12 million minutes in mid-2004. Interestingly, the popularity of mobile phones cut the duration of calls made by the national fixed lines, but the use of landlines for international calls slowly rose over time. During 2004, more than 7 million minutes of international calls were made by Danes, which was one million higher than fixed-line calls in 1995. Finally, local landline calls registered as high as 15 million minutes in mid-2001, and after a steady decline, they dropped to 8 million minutes in 2004.
Model Answer 2:
The line graph illustrates the total duration of telephone calls made in Denmark between 1995 and 2004, measured in million minutes and divided into three categories: national landline, international landline, and mobile calls.
Overall, national landline calls by Danes accounted for the largest share for most of the period, rising to a peak around 2000 before declining noticeably. In contrast, both international landline and mobile calls increased throughout the decade, with mobile usage showing by far the fastest growth.
In 1995, Danes talked approximately 12 million minutes on national landline calls, which was well above the figures for international calls (about 6 million) and mobiles (roughly 1 million). National landline use then climbed steadily over the next five years, reaching a high of just over 16 million minutes in 2000. After that, it gradually fell, dropping to around 12 million in 2003 and ending at approximately 9 million minutes in 2004.
Meanwhile, international landline calls grew slowly but consistently, increasing from about 6 million minutes in 1995 to nearly 7.6 million by 2004. Mobile phones gained rapid popularity, and more Danes started to talk on mobile phones. Their use followed a very different pattern: after a modest beginning (around 1 million minutes in 1995) to about 3 million in 2000, and then continued climbing rapidly to reach approximately 12 million minutes in 2004. During that time, Danes talked on mobile phones more than they did using national and international landline calls.
The provided line graph gives information about the total duration of telephone talking time of Danish people between 1995 and 2004. Data is categorized into three different types of calls, namely national, international and mobile phone.
Overall, it is observed that the duration of national landline usage is the longest over the given period. However, mobile phone calls saw the most noticeable increase throughout the years. More specific information will be summarized below.
As the diagram suggests, people across Denmark spent 12 million minutes in 1995 to make calls within the country. This figure is exactly twice as much as that of international calls, and more than ten times than that of mobile usage in the same year. As time passed by, both international landline and mobile phone saw a rise in call duration. International call increased steadily each year to become approximately 7 million minutes by 2004, which means the figure went up by about one-seventh compared with that of nine years ago. Mobile phone calls soared to 3 million minutes in 2000 before skyrocketing four-fold four years later.
Regarding national calls, the figure reached its highest point of 16 million minutes in 2000 and remained at that point for a year before decreasing steeply to 8 million in 2004, exactly one million more than international ones and 4 million less than mobile ones (also in the year 2004). Another look at the graph suggests that the combined call durations in 2004 and 2001 were the largest, approximately 27 million minutes in total for both years.