IELTS Academic Writing Task 1/ Graph Writing – Line Chart:
You should spend about 20 minutes on this task.
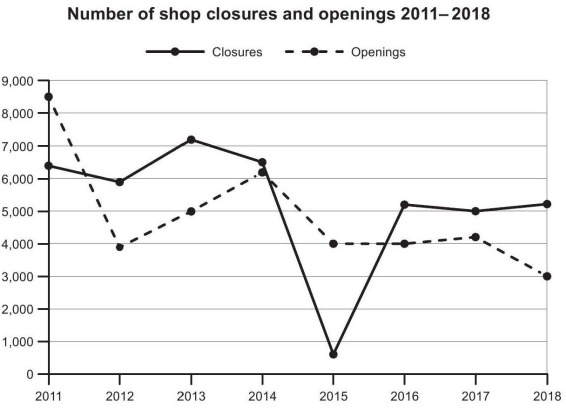
The graph below shows the number of shops that closed and the number of new shops that opened in one country between 2011 and 2018.
Summarise the information by selecting and reporting the main features, and make comparisons where relevant.
Write at least 150 words.
Model Answer:
The line graph illustrates the number of shops that closed and the number of new stores that opened in a country between 2011 and 2018.
Overall, shop closures exceeded shop openings for most of the period, except for 2011, 2014 and 2015, despite considerable fluctuations in both trends.
In 2011, around 5,000 shops shut down, while approximately 8,500 new shops emerged, making it a year when openings significantly outnumbered closures. However, in 2012, the number of stores that closed increased sharply to 6,000, and roughly 4,000 new shops started their business. Over the next two years, the trend shifted. Shop closures gradually declined to about 6,500, while openings rebounded to just over 6,000 by 2014, bringing the two metrics closer together.
The most dramatic change occurred in 2015, when shop closures plunged to their lowest point (under 800 only), and roughly 4,000 new shops opened. This steep fall in closures was temporary, as by 2016, the number of shops closing rebounded to over 5,000. In the final two years, closures continued to roughly 5,000, while openings of new shops declined further to approximately 3,000 by the end of the period.