IELTS Academic Writing Task 1/ Graph Writing – Table + Pie Chart:
You should spend about 20 minutes on this task.
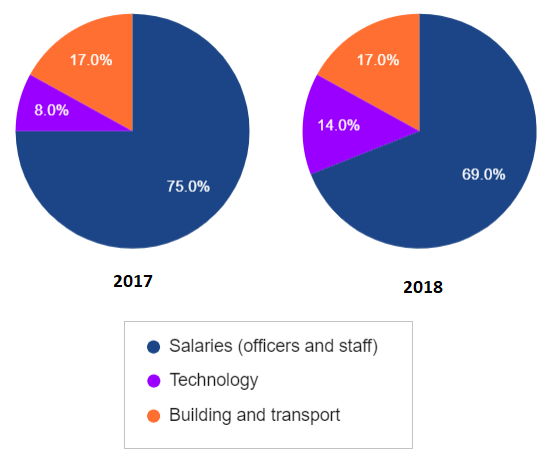
The table and charts below give information on the police budget for 2017 and 2018 in one area of Britain. The table shows where the money came from and the charts show how it was distributed.
Summarise the information by selecting and reporting the main features, and make comparisons where relevant.
Write at least 150 words.
Police Budget 2017-2018 (in £m)

How the money was spent
Model Answer:
The table and pie charts present a comparative report about the police budget in a particular part of Britain for the years 2017 and 2018. The table breaks down the source of the money, while the pie charts show how the budget was allocated across salaries, technology, and buildings & transport.
Overall, the total budget for the police rose slightly from 2017 to 2018, with the largest chunk coming from the national government in both years. On the spending side, salaries accounted for the majority of expenditure.
In 2017, the police in a particular area of Britain had a total budget of 304 million pounds, which increased by roughly 14 million pounds during the next year. National government funding provided the biggest portion of this budget, which was over 175 million pounds in 2017, and approximately £178 million in 2018. Local taxes showed a more significant increase as a source of this budget, surging from £91 million to slightly over £102 million. Finally, sources like grants climbed from £38 million to £38.5 million in a year.
Regarding how the budget money was spent, it is clear that officer and staff salaries made up 75% of the total budget in 2017, but dropped to 69% in 2018. Meanwhile, money spent on technology nearly doubled, growing from 8% to 14% during the same period. The shares allocated to buildings and transport remained stable at 17% in both years.