IELTS Academic Writing Task 1/ Graph Writing – Bar Chart:
You should spend about 20 minutes on this task.
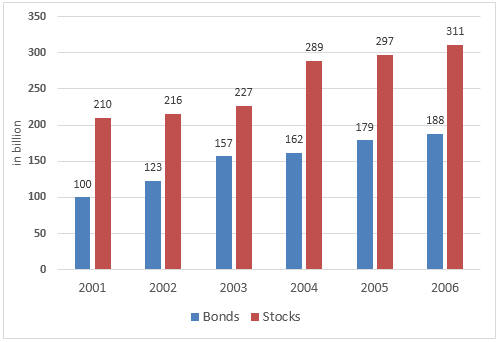
The graph below shows the way people of a country invested their money in the stock market during the years 2001-2006.
Summarize the information by selecting and reporting the main features, and make comparisons where relevant.
You should write at least 150 words.
Money invested in the stock market in a country (in billion USD)
Model Answer 1:
The bar chart illustrates the amount of money, in billions of US dollars, that people in a certain country invested in bonds and stocks between 2001 and 2006.
Overall, it is clear that investment in both stocks and bonds increased steadily over the period, and at every point, stocks attracted significantly more funds than bonds.
In 2001, people invested 100 billion in bonds, whereas 210 billion was put into stocks. Over the next two years, both types of investment grew gradually, with bonds rising to over 150 billion and stocks to over 225 billion by 2003. The gap between the two widened further in subsequent years. Between 2003 and 2004, investments in stocks jumped sharply to nearly 290 billion, while bonds saw a more modest rise to more than 160 billion. This upward trajectory continued until 2006, when stock investments reached a peak of 311 billion, nearly double the amount invested in bonds, which totalled 188 billion in that year.
Sample Answer 2:
The column graph illustrates how much money citizens of a country invested in the stock market from 2001 to 2006. The investment amount is given in billions of US dollars, and is categorised in bonds and stocks.
A glance at the bar chart reveals that the amount invested in the stock market increased steadily over time, and people invested considerably more money in stocks than they did in bonds.
As is presented in the graph, people in this country bought bonds worth 100 billion and stocks worth 210 billion US dollars in 2001. Next year, the investment slightly grew both for bonds and stocks and went further up in 2003. People’s investment in stock went as high as 289 billion in 2004, compared to 162 billion in bonds. The same trend continued in the next two years. Finally, in 2006, their total investment in stocks amounted to over $300 billion, which was almost a 50% increase from that of 5 years earlier. This year, people purchased bonds worth 188 billion, around 120 billion less than that of stocks, but exactly 88 billion more than that of 2001. Clearly, the investment in stocks and bonds by people in this country increased steadily over the six years.